Peter Lobner, updated 26 October 2023
1. Overview of US military optical reconnaissance satellite programs
The National Reconnaissance Office (NRO) is responsible for developing and operating space reconnaissance systems and conducting intelligence-related activities for US national security. NRO developed several generations of classified Keyhole (KH) military optical reconnaissance satellites that have been the primary sources of Earth imagery for the US Department of Defense (DoD) and intelligence agencies. NRO’s website is here:
NRO’s early generations of Keyhole satellites were placed in low Earth orbits, acquired the desired photographic images on film during relatively short-duration missions, and then returned the film to Earth in small reentry capsules for airborne recovery. After recovery, the film was processed and analyzed. The first US military optical reconnaissance satellite program, code named CORONA, pioneered the development and refinement of the technologies, equipment and systems needed to deploy an operational orbital optical reconnaissance capability. The first successful CORONA film recovery occurred on 19 August 1960.
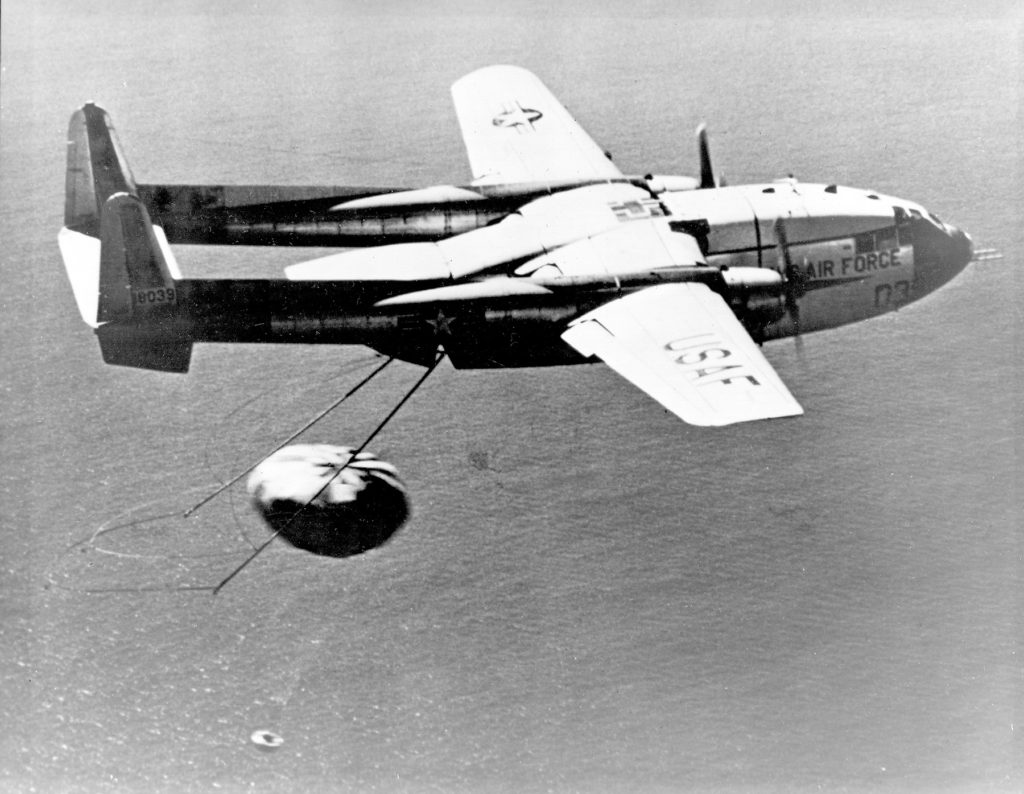
CORONA film canister in flight. Source: US Air Force
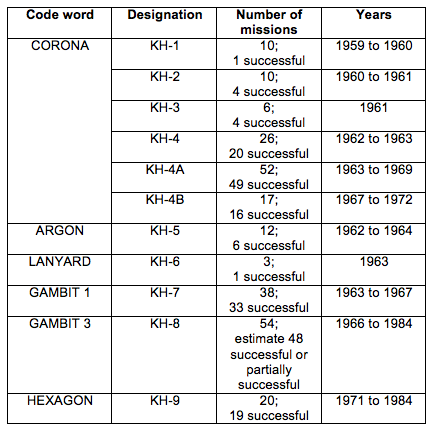
Keyhole satellites are identified by a code word and a “KH” designator, as summarized in the following table.
In 1976, NRO deployed its first electronic imaging optical reconnaissance satellite known as KENNEN KH-11 (renamed CRYSTAL in 1982), which eventually replaced the KH-9, and brought an end to reconnaissance satellite missions requiring film return. The KH-11 flies long-duration missions and returns its digital images in near real time to ground stations for processing and analysis. The KH-11, or an advanced version sometimes referred to as the KH-12, is operational today.
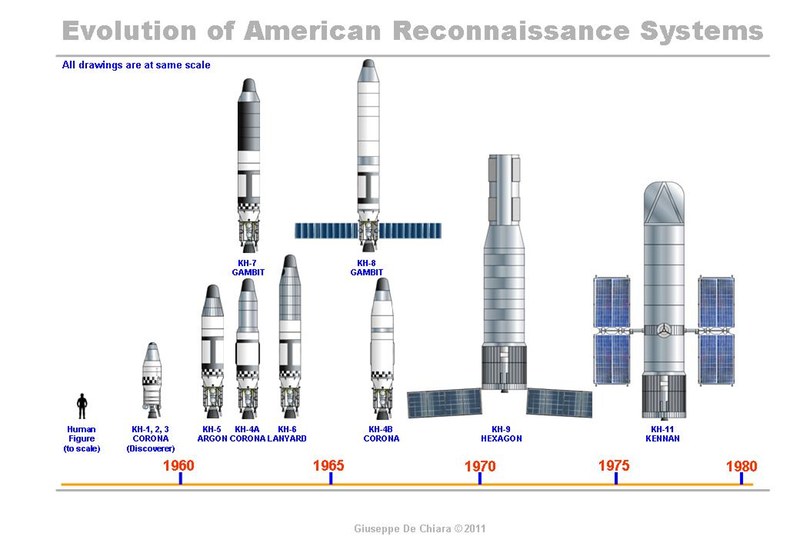
with the KH-11 electronic imaging reconaissance satellite.
Credit: Giuseppe De Chiara and The Space Review.
Geospatial intelligence, or GEOINT, is the exploitation and analysis of imagery and geospatial information to describe, assess and visually depict physical features and geographically referenced activities on the Earth. GEOINT consists of imagery, imagery intelligence and geospatial information. Satellite imagery from Keyhole reconnaissance satellites is an important information source for national security-related GEOINT activities.
The National Geospatial-Intelligence Agency (NGA), which was formed in 2003, has the primary mission of collecting, analyzing, and distributing GEOINT in support of national security. NGA’s predecessor agencies, with comparable missions, were:
- National Imagery and Mapping Agency (NIMA), 1996 – 2003
- National Photographic Interpretation Center (NPIC), a joint project of the Central Intelligence Agency (CIA) and DoD, 1961 – 1996
The NGA’s web homepage, at the following link: https://www.nga.mil/Pages/Default.aspx
The NGA’s webpage for declassified satellite imagery is here: https://www.nga.mil/ProductsServices/Pages/Imagery.aspx
2. The advent of the US civilian Earth observation programs
Collecting Earth imagery from orbit became an operational US military capability more than a decade before the start of the joint National Aeronautics & Space Administration (NASA) / US Geological Survey (USGS) civilian Landsat Earth observation program. The first Landsat satellite was launched on 23 July 1972 with two electronic observing systems, both of which had a spatial resolution of about 80 meters (262 feet).
Since 1972, Landsat satellites have continuously acquired low-to-moderate resolution digital images of the Earth’s land surface, providing long-term data about the status of natural resources and the environment. Resolution of the current generation multi-spectral scanner on Landsat 9 is 30 meters (98 feet) in visible light bands.
You’ll find more information on the Landsat program on the USGS website here: https://www.usgs.gov/land-resources/nli/landsat
3. Declassification of certain military reconnaissance satellite imagery
All military reconnaissance satellite imagery was highly classified until 1995, when some imagery from early defense reconnaissance satellite programs was declassified. The USGS explains:
“The images were originally used for reconnaissance and to produce maps for U.S. intelligence agencies. In 1992, an Environmental Task Force evaluated the application of early satellite data for environmental studies. Since the CORONA, ARGON, and LANYARD data were no longer critical to national security and could be of historical value for global change research, the images were declassified by Executive Order 12951 in 1995”
You can read Executive Order 12951 here: https://www.govinfo.gov/content/pkg/WCPD-1995-02-27/pdf/WCPD-1995-02-27-Pg304.pdf
Additional sets of military reconnaissance satellite imagery were declassified in 2002 and 2011 based on extensions of Executive Order 12951.
The declassified imagery is held by the following two organizations:
- The original film is held by the National Archives and Records Administration (NARA).
- Duplicate film held in the USGS Earth Resources Observation and Science (EROS) Center archive is used to produce digital copies of the imagery for distribution to users.
The declassified military satellite imagery available in the EROS archive is summarized below:
USGS EROS Archive – Declassified Satellite Imagery – 1 (1960 to 1972)
- This set of photos, declassified in 1995, consists of more than 860,000 images of the Earth’s surface from the CORONA, ARGON, and LANYARD satellite systems.
- CORONA image resolution improved from 40 feet (12.2 meters) for the KH-1 to about 6 feet (1.8 meters) for the KH-4B.
- KH-5 ARGON image resolution was about 460 feet (140 meters).
- KH-6 LANYARD image resolution was about 6 feet (1.8 meters).
USGS EROS Archive – Declassified Satellite Imagery – 2 (1963 to 1980)
- This set of photos, declassified in 2002, consists of photographs from the KH-7 GAMBIT surveillance system and KH-9 HEXAGON mapping program.
- KH-7 image resolution is 2 to 4 feet (0.6 to 1.2 meters). About 18,000 black-and-white images and 230 color images are available.
- The KH-9 mapping camera was designed to support mapping requirements and exact positioning of geographical points. Not all KH-9 satellite missions included a mapping camera. Image resolution is 20 to 30 feet (6 to 9 meters); significantly better than the 98 feet (30 meter) resolution of LANDSAT imagery. About 29,000 mapping images are available.
USGS EROS Archive – Declassified Satellite Imagery – 3 (1971 to 1984)
- This set of photos, declassified in 2011, consists of more photographs from the KH-9 HEXAGON mapping program. Image resolution is 20 to 30 feet (6 to 9 meters).
More information on the declassified imagery resources is available from the USGS EROS Archive – Products Overview webpage at the following link (see heading “Declassified Data”): https://www.usgs.gov/centers/eros/science/usgs-eros-archive-products-overview?qt-science_center_objects=0#qt-science_center_objects
4. Example applications of declassified military reconnaissance satellite imagery
The declassified military reconnaissance satellite imagery provides views of the Earth starting in the early 1960s, more than a decade before civilian Earth observation satellites became operational. The military reconnaissance satellite imagery, except from ARGON KH-5, is higher resolution than is available today from Landsat civilian earth observation satellites. The declassified imagery is an important supplement to other Earth imagery sources. Several examples applications of the declassified imagery are described below.
4.1 Assessing Aral Sea depletion
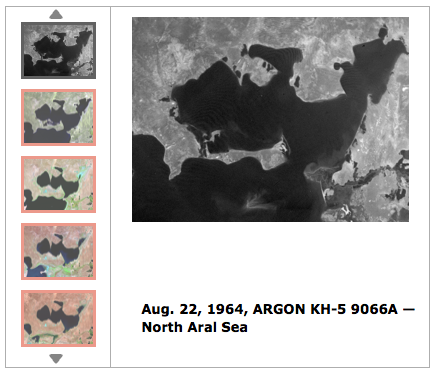
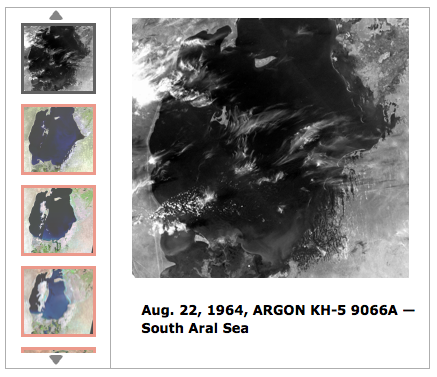
USGS reports: “The Aral Sea once covered about 68,000 square kilometers, a little bigger than the U.S. state of West Virginia. It was the 4th largest lake in the world. It is now only about 10% of the size it was in 1960…..In the 1990s, a dam was built to prevent North Aral water from flowing into the South Aral. It was rebuilt in 2005 and named the Kok-Aral Dam…..The North Aral has stabilized but the South Aral has continued to shrink and become saltier. Up until the 1960s, Aral Sea salinity was around 10 grams per liter, less than one-third the salinity of the ocean. The salinity level now exceeds 100 grams per liter in the South Aral, which is about three times saltier than the ocean.”
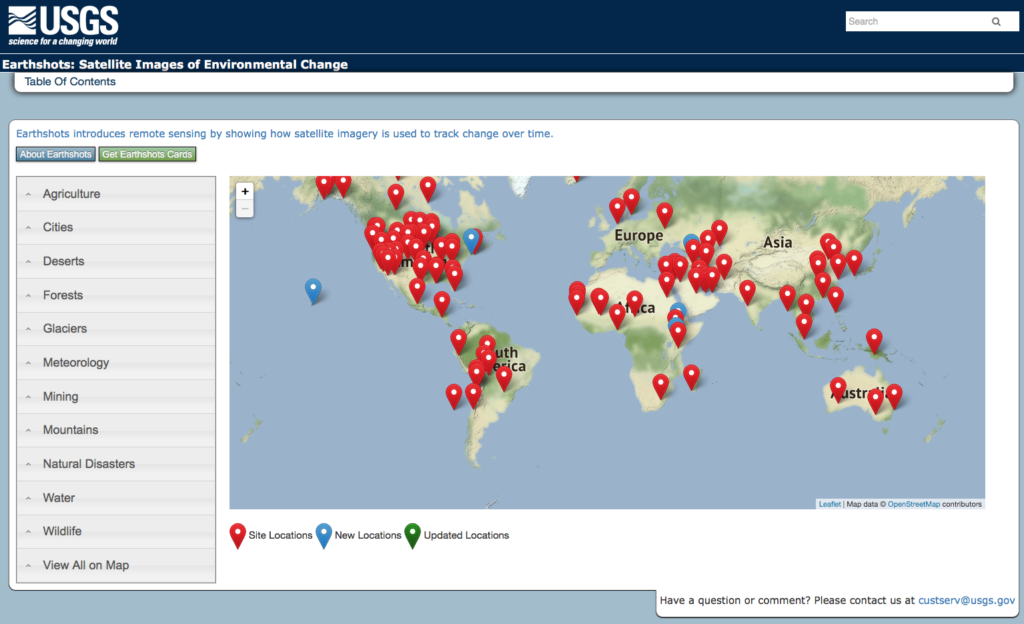
On the USGS website, the “Earthshots: Satellite Images of Environmental Change” webpages show the visible changes at many locations on Earth over a 50+ year time period. The table of contents to the Earthshots webpages is shown below and is at the following link: http:// https://earthshots.usgs.gov/earthshots/
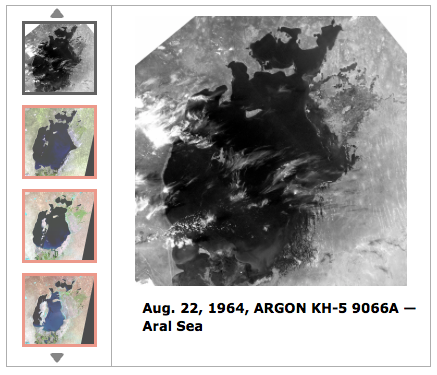
For the Aral Sea region, the Earthshots photo sequences start with ARGON KH-5 photos taken in 1964. Below are three screenshots of the USGS Earthshots pages showing the KH-5 images for the whole the Aral Sea, the North Aral Sea region and the South Aral Sea region. You can explore the Aral Sea Earthshots photo sequences at the following link: https://earthshots.usgs.gov/earthshots/node/91#ad-image-0-0
4.2 Assessing Antarctic ice shelf condition
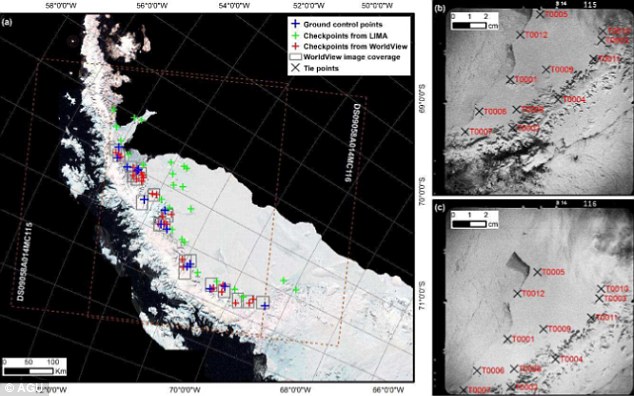
In a 7 June 2016 article entitled, ”Spy satellites reveal early start to Antarctic ice shelf collapse,” Thomas Sumner reported:
“Analyzing declassified images from spy satellites, researchers discovered that the downhill flow of ice on Antarctica’s Larsen B ice shelf was already accelerating as early as the 1960s and ’70s. By the late 1980s, the average ice velocity at the front of the shelf was around 20 percent faster than in the preceding decades,….”
You can read the complete article on the ScienceNews website here: https://www.sciencenews.org/article/spy-satellites-reveal-early-start-antarctic-ice-shelf-collapse
Source: Daily Mail, 10 June 2016
4.3 Assessing Himalayan glacier condition
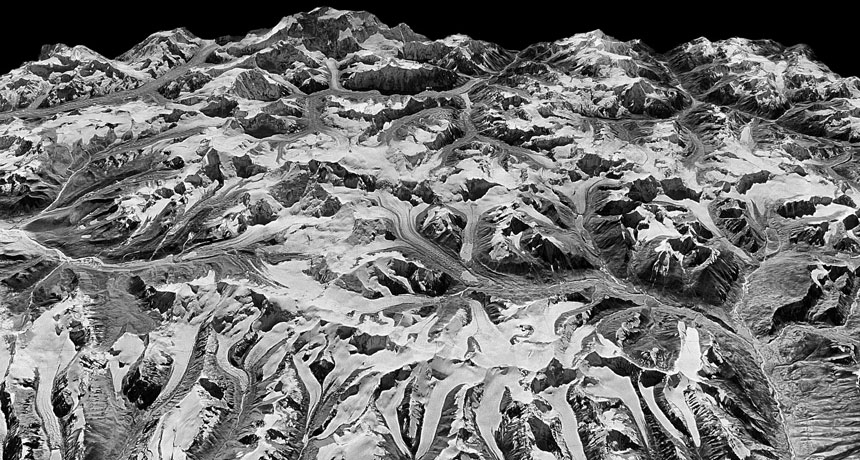
In a 19 June 2019 paper “Acceleration of ice loss across the Himalayas over the past 40 years,” the authors, reported on the use of HEXAGON KH-9 mapping camera imagery to improve their understanding of trends affecting the Himalayan glaciers from 1975 to 2016:
“Himalayan glaciers supply meltwater to densely populated catchments in South Asia, and regional observations of glacier change over multiple decades are needed to understand climate drivers and assess resulting impacts on glacier-fed rivers. Here, we quantify changes in ice thickness during the intervals 1975–2000 and 2000–2016 across the Himalayas, using a set of digital elevation models derived from cold war–era spy satellite film and modern stereo satellite imagery.”
“The majority of the KH-9 images here were acquired within a 3-year interval (1973–1976), and we processed a total of 42 images to provide sufficient spatial coverage.”
“We observe consistent ice loss along the entire 2000-km transect for both intervals and find a doubling of the average loss rate during 2000–2016.”
“Our compilation includes glaciers comprising approximately 34% of the total glacierized area in the region, which represents roughly 55% of the total ice volume based on recent ice thickness estimates.”
You can read the complete paper by J. M. Maurer, et al., on the Science Advances website here: https://advances.sciencemag.org/content/5/6/eaav7266
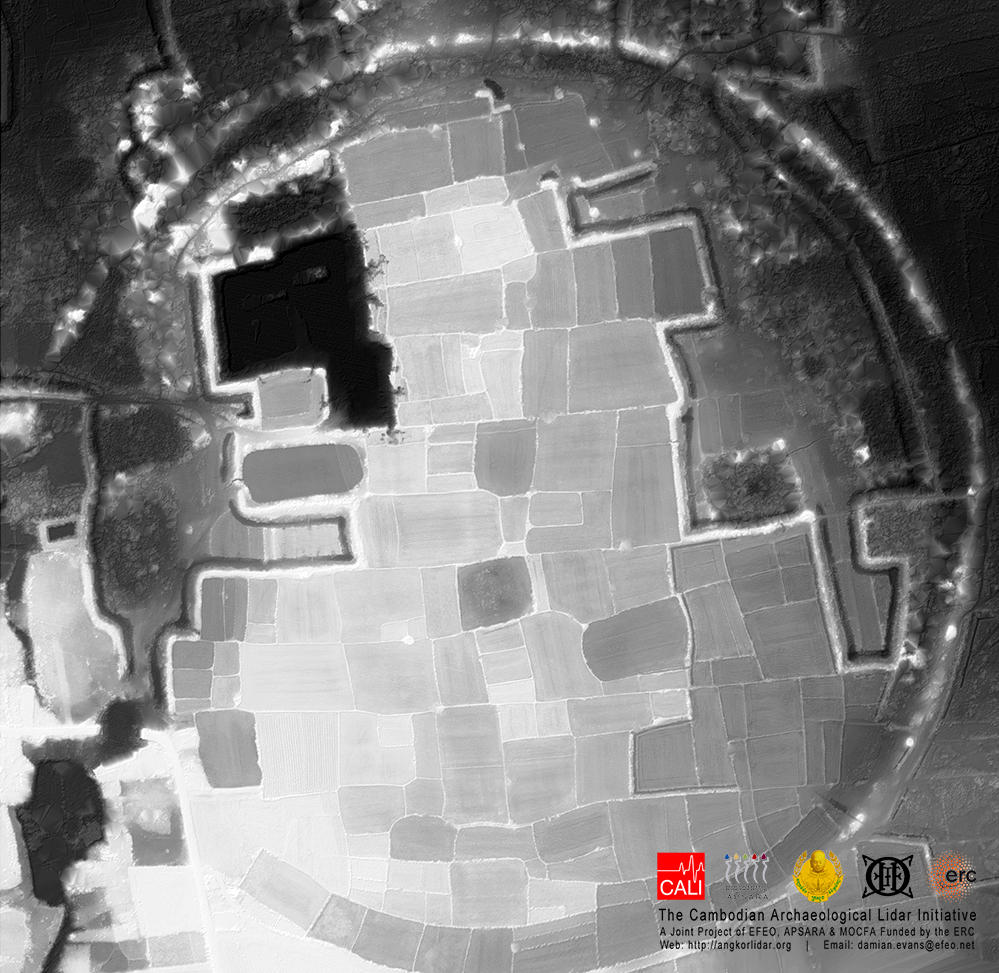
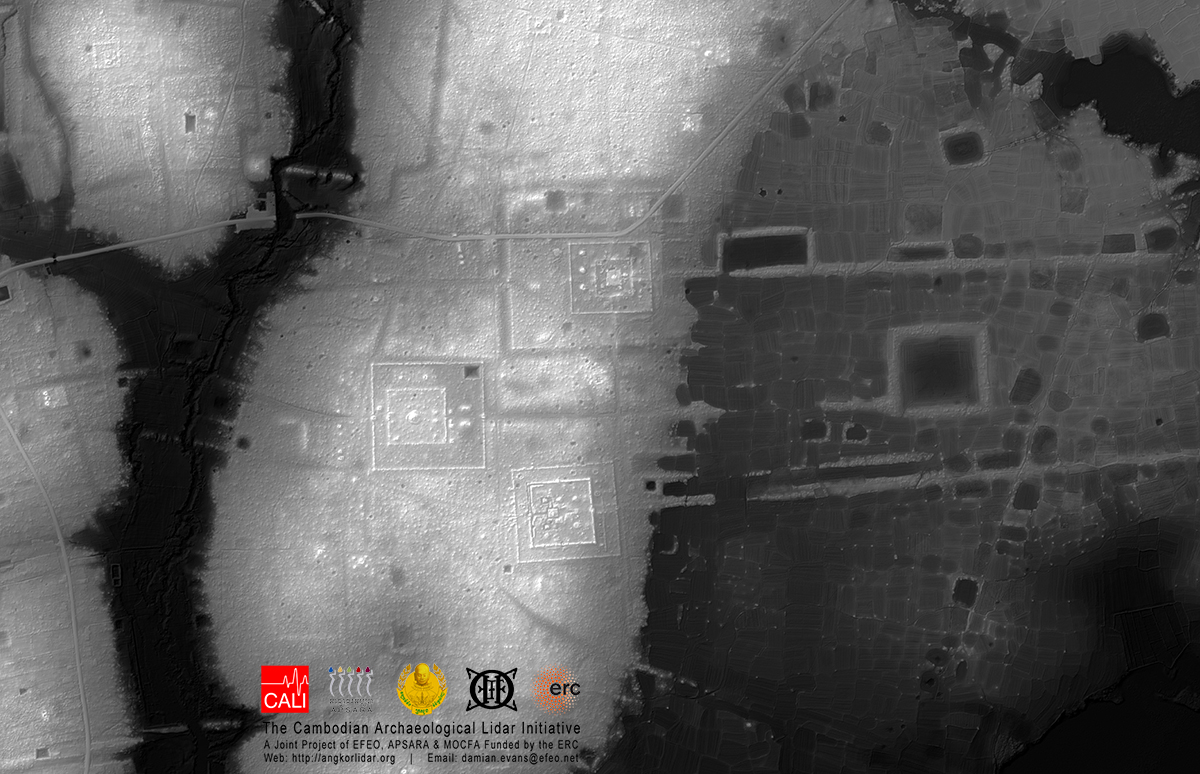
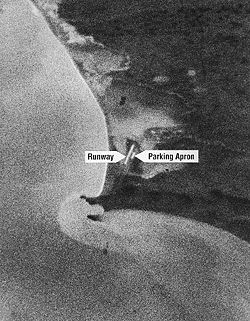
4.4 Discovering archaeological sites
A. CORONA Atlas Project
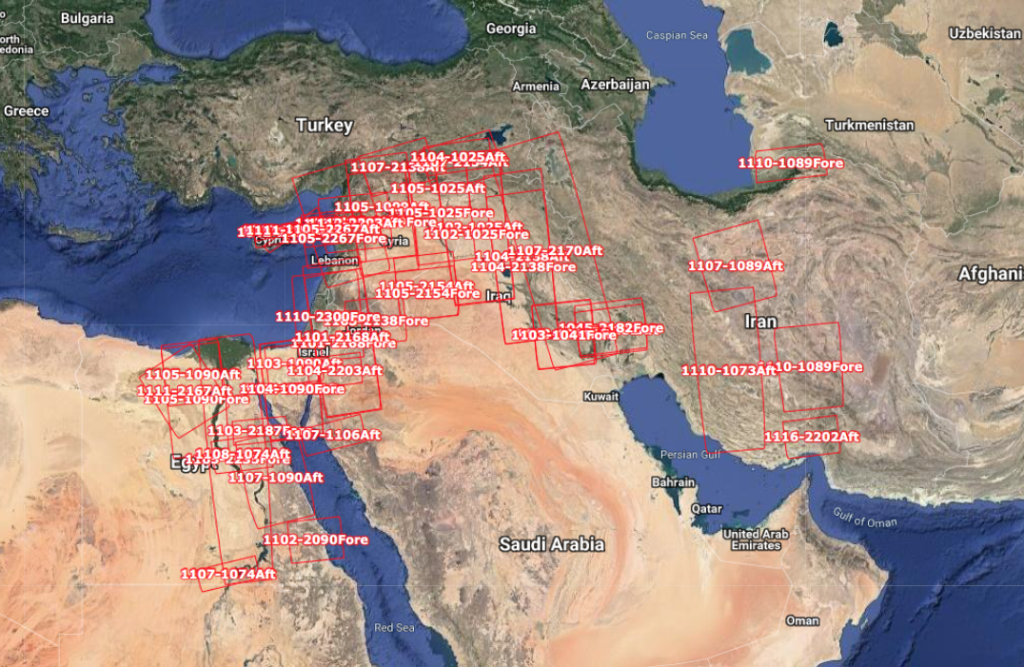
The Center for Advanced Spatial Technologies, a University of Arkansas / U.S. Geological Survey collaboration, has undertaken the CORONA Atlas Project using military reconnaissance satellite imagery to create the “CORONA Atlas & Referencing System”. The current Atlas focuses on the Middle East and a small area of Peru, and is derived from 1,024 CORONA images taken on 50 missions. The Atlas contains 833 archaeological sites.
“In regions like the Middle East, CORONA imagery is particularly important for archaeology because urban development, agricultural intensification, and reservoir construction over the past several decades have obscured or destroyed countless archaeological sites and other ancient features such as roads and canals. These sites are often clearly visible on CORONA imagery, enabling researchers to map sites that have been lost and to discover many that have never before been documented. However, the unique imaging geometry of the CORONA satellite cameras, which produced long, narrow film strips, makes correcting spatial distortions in the images very challenging and has therefore limited their use by researchers.”
with data available.
CAST reports that they have “developed methods for efficient
orthorectification of CORONA imagery and now provides free public access to our imagery database for non-commercial use. Images can be viewed online and full resolution images can be downloaded in NITF format.”
The can explore the CORONA Atlas & Referencing System here: https://corona.cast.uark.edu
B. Dartmouth “Fertile Crescent” Study
In October 2023, a team from Dartmouth College published a paper that described their recent discovery of 396 Roman-era forts using declassified CORONA and HEXAGON spy satellite imagery of regions of Syria, Iraq and nearby “fertile crescent” territories of the eastern Mediterranean. The study area is shown in the following map. A previous aerial survey of the area in 1934 had identified 116 other forts in the same region.
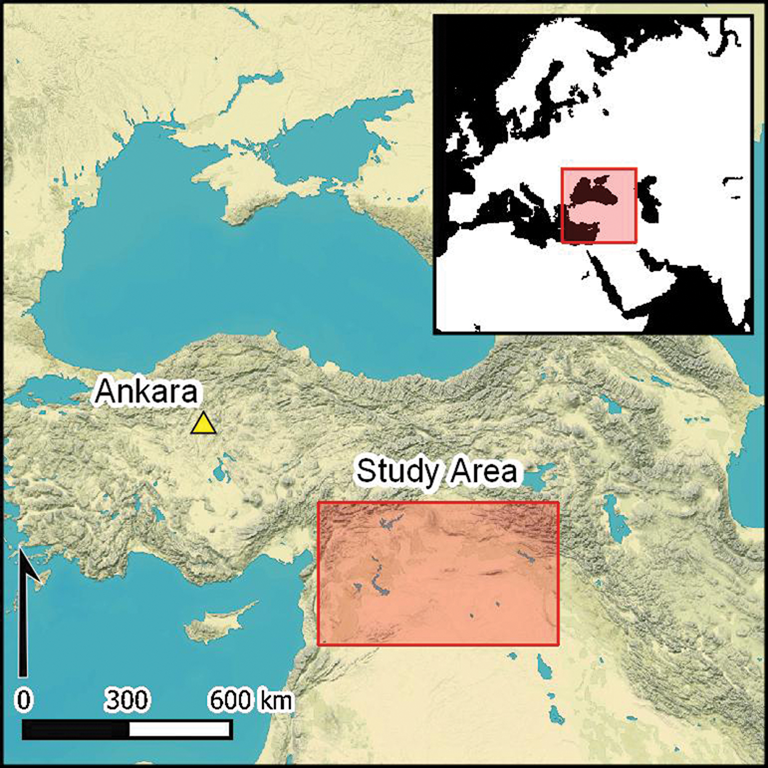
Dartmouth study area. Source: J. Casana, et al. (26 October 2023)
The authors noted, “Perhaps the most significant realization from our work concerns the spatial distribution of the forts across the landscape, as this has major implications for our understanding of their intended purpose as well as for the administration of the eastern Roman frontier more generally.”
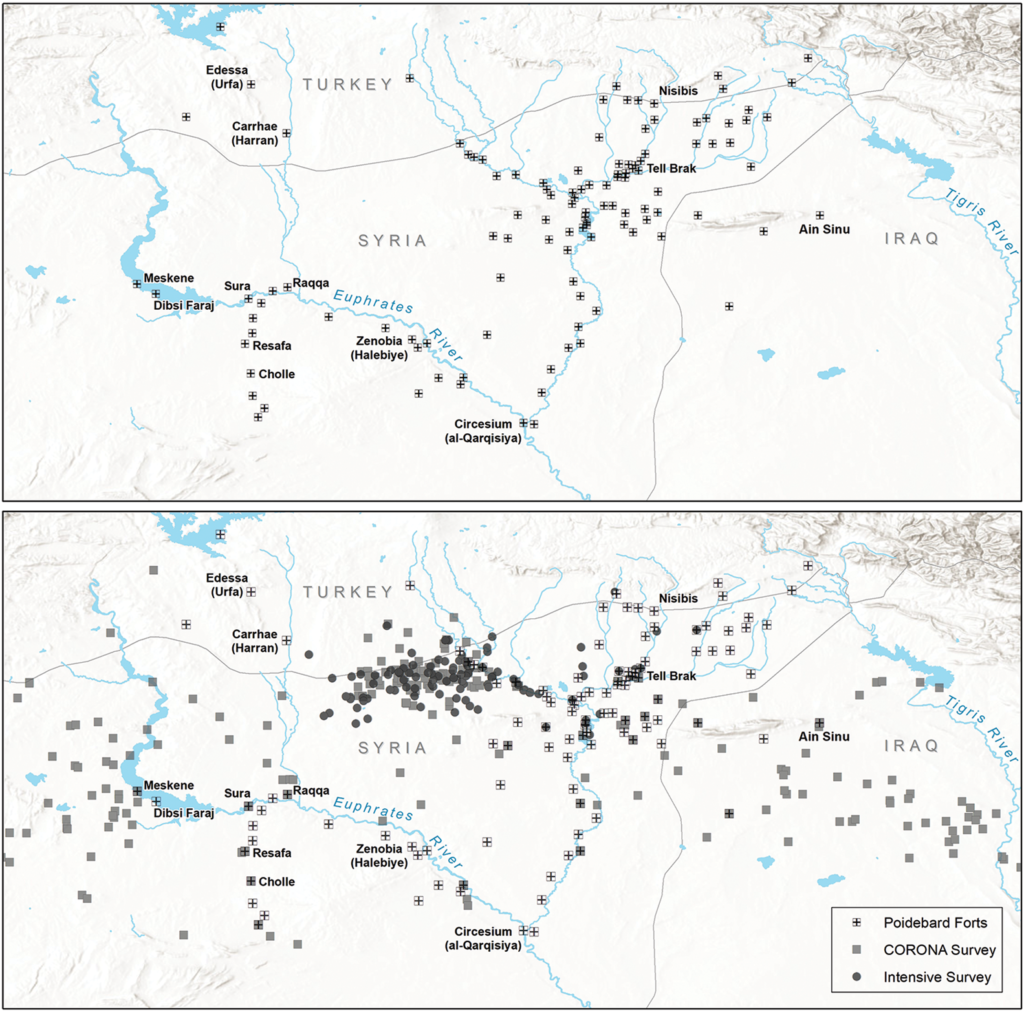
Comparison of the distribution of forts documented in the 1934 aerial survey (top)and forts found recently on declassified satellite imagery (bottom). Source: Figure 9, J. Casana, et al. (26 October 2023)
Examples of the new forts identified by the Dartmouth team in satellite imagery are shown in the following figures.
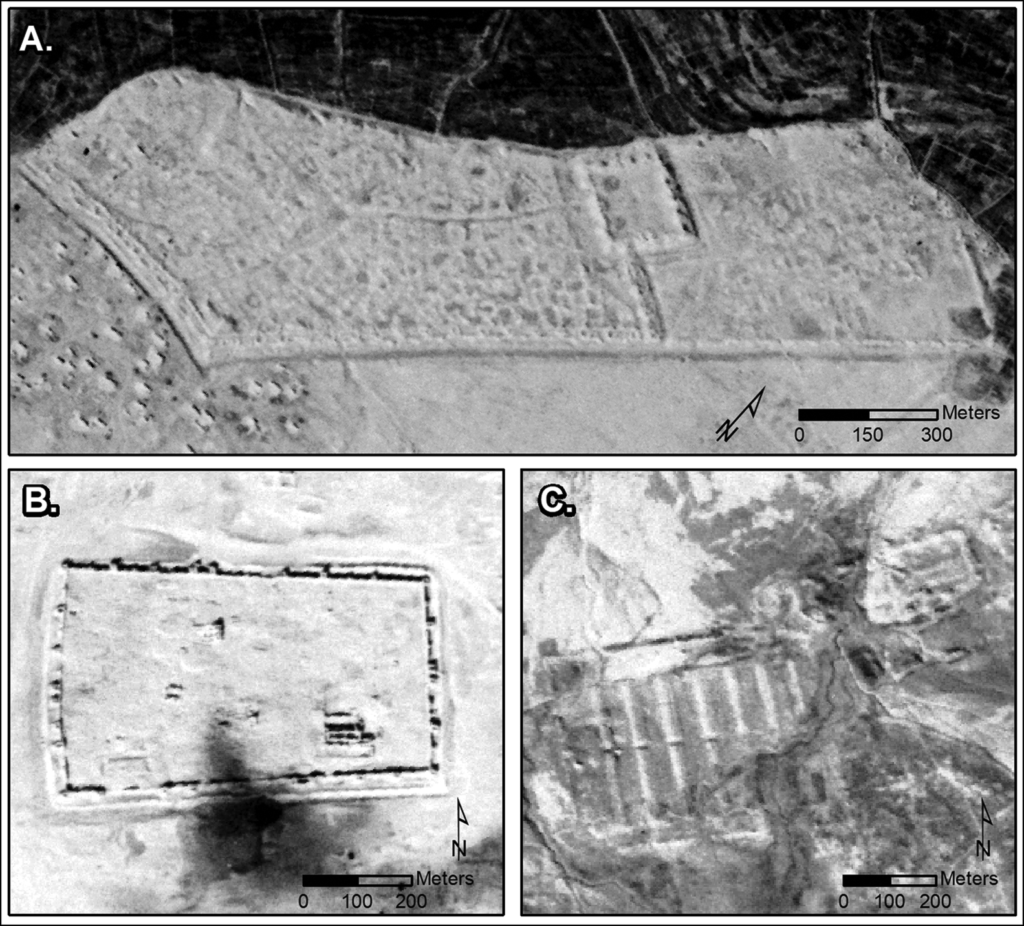
CORONA images showing three major sites: (A) Sura (NASA1401); (B) Resafa (NASA1398); and (C) Ain Sinu (CRN999). Source: Figure 3, J. Casana, et al. (26 October 2023)
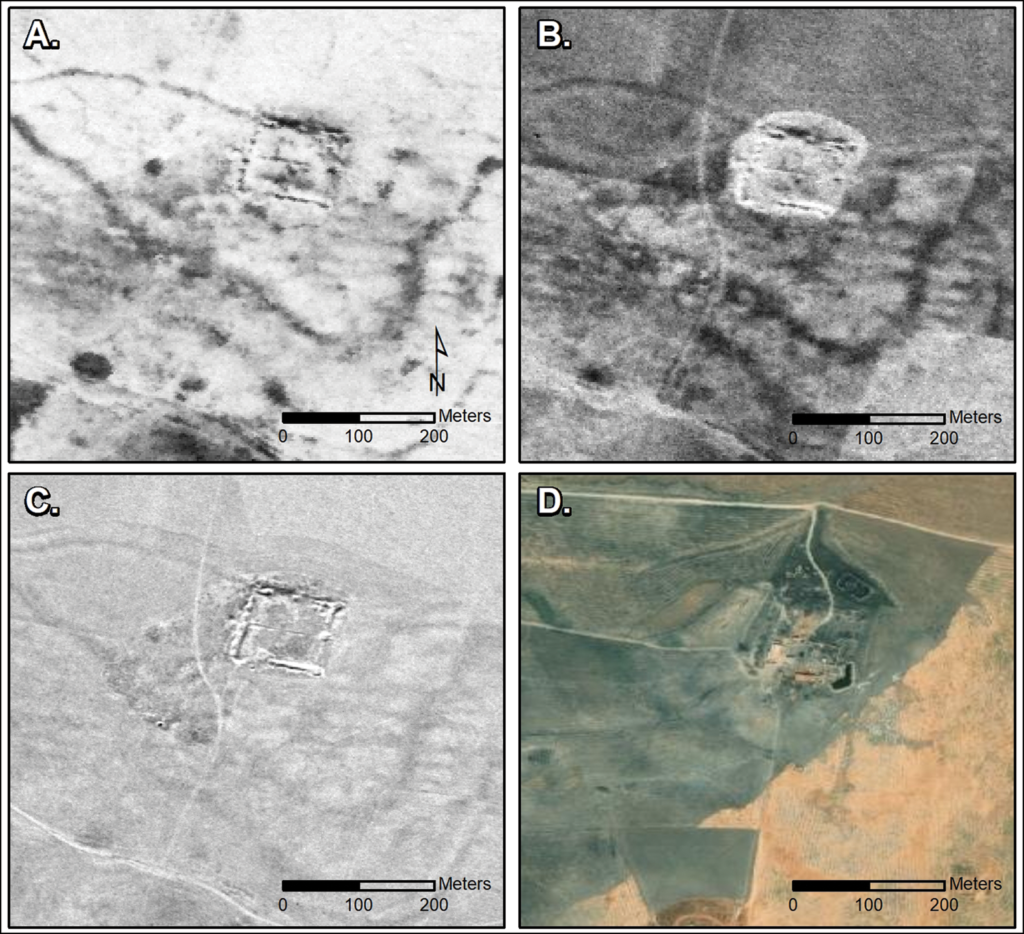
Castellum at Tell Brak site in multiple images: (A) CORONA (1102, 17 December 1967); (B) CORONA (1105, 4 November 1968); (C) HEXAGON (1204, 17 November 1974); and (D) modern satellite imagery. Source: Figure 4, J. Casana, et al. (26 October 2023)
The teams paper concludes: “Finally, the discovery of such a large number of previously undocumented ancient forts in this well-studied region of the Near East is a testament to the power of remote-sensing technologies as transformative tools in contemporary archaeological research.”
4.5 Conducting commercial geospatial analytics over a broader period of time
The firm Orbital Insight, founded in 2013, is an example of commercial firms that are mining geospatial data and developing valuable information products for a wide range of customers. Orbital Insight reports:
“Orbital Insight turns millions of images into a big-picture understanding of Earth. Not only does this create unprecedented transparency, but it also empowers business and policy decision makers with new insights and unbiased knowledge of socio-economic trends. As the number of Earth-observing devices grows and their data output expands, Orbital Insight’s geospatial analytics platform finds observational truth in an interconnected world. We map out and quantify the world’s complexities so that organizations can make more informed decisions.”
“By applying artificial intelligence to satellite, UAV, and other geospatial data sources, we seek to discover and quantify societal and economic trends on Earth that are indistinguishable to the human eye. Combining this information with terrestrial data, such as mobile and location-based data, unlocks new sources of intelligence.”
The Orbital Insight website is here: https://orbitalinsight.com/company/
5. Additional reading related to US optical reconnaissance satellites
You’ll find more information on the NRO’s film-return, optical reconnaissance satellites (KH-1 to KH-9) at the following links:
- Robert Perry, “A History of Satellite Reconnaissance,” Volumes I to V, National Reconnaissance Office (NRO), various dates 1973 – 1974; released under FOIA and available for download on the NASA Spaceflight.com website, here: https://forum.nasaspaceflight.com/index.php?topic=20232.0
- Kevin C. Ruffner (Editor), “CORONA: America’s First Satellite Program,” CIA War Records Series, Central Intelligence Agency, 1995; https://www.cia.gov/library/center-for-the-study-of-intelligence/csi-publications/books-and-monographs/corona.pdf
- ARGON KH-5 Reconnaissance Satellite; https://en.wikipedia.org/wiki/KH-5_Argon
- LANYARD KH-6 Reconnaissance Satellite; https://en.wikipedia.org/wiki/KH-6_Lanyard
- GAMBIT 1 KH-7 Reconnaissance Satellite; https://www.nationalmuseum.af.mil/Visit/Museum-Exhibits/Fact-Sheets/Display/Article/195920/gambit-1-kh-7-reconnaissance-satellite/
- GAMBIT 3 KH-8 Reconnaissance Satellite; https://www.nationalmuseum.af.mil/Visit/Museum-Exhibits/Fact-Sheets/Display/Article/195922/gambit-3-kh-8-reconnaissance-satellite/
- HEXAGON KH-9 Reconnaissance Satellite; https://www.nationalmuseum.af.mil/Visit/Museum-Exhibits/Fact-Sheets/Display/Article/195921/hexagon-kh-9-reconnaissance-satellite/
- Roger Guillemette, “Declassified US Spy Satellites Reveal Rare Look at Secret Cold War Space Program,” Space.com, 18 September 2011: https://www.space.com/12996-secret-spy-satellites-declassified-nro.html
You’ll find details on NRO’s electronic optical reconnaissance satellites (KH-11, KH-12) at the following links:
- Craig Covault, “Top Secret KH-11 Spysat Design Revealed By NRO’s Twin Telescope Gift to NASA,” 6 June 2012; https://www.americaspace.com/2012/06/06/top-secret-kh-11-spysat-design-revealed-by-nros-twin-telescope-gift-to-nasa/
- Ralf Vandebergh, “KH-12 Keenan Keyhole Secret Military Spy Satellite Photos,” Space Safety Magazine, 26 September 2013; http://www.spacesafetymagazine.com/space-debris/astrophotography/view-keyhole-satellite/
- Gunter’s Space Page (https://space.skyrocket.de/index.html) provides details on all Keyhole military reconnaissance satellites, starting with CORONA KH-1 here: https://space.skyrocket.de/doc_sdat/kh-1.htm
6. Additional reading related to civilian use of declassified spy satellite imagery
General:
- US Geologic Survey Fact Sheet 2008-3054, “Declassified Intelligence Satellite Photographs,” July 2008; https://pubs.usgs.gov/fs/2008/3054/pdf/fs2008-3054.pdf
Assessing Aral Sea depletion:
- Fariss Samarrai, “Cold war-era spy satellite images reveal possible effects of climate change,” Phys Org, 10 April 2017; https://news.virginia.edu/content/cold-war-era-spy-satellite-images-reveal-possible-effects-climate-change
- “The Aral Sea, Before the Streams Ran Dry,” NASA Earth Observatory, https://earthobservatory.nasa.gov/images/77193/the-aral-sea-before-the-streams-ran-dry
Assessing Antarctic ice sheet condition:
- Richard Grey, “The spy photos that reveal an early start to Antarctic melt: Biggest ice shelf collapse on record began in the 1960s,” Daily Mail, 10 June 2016; https://www.dailymail.co.uk/sciencetech/article-3635121/The-SPY-PHOTOS-reveal-early-start-Antarctic-melt-Biggest-ice-shelf-collapse-record-began-1960s.html
- Wenkai Ye, et al., “Improved Geometric Modeling of 1960s KH-5 ARGON Satellite Images for Regional Antarctic Applications,” Photogrammetric Engineering & Remote Sensing, Vol. 83, No. 7, July 2017. Abstract only at: http://www.asprs.org/a/publications/pers/2017journals/PERS_July_2017_Public/HTML/files/assets/common/downloads/page0019.pdf
Assessing Himalayan glacier condition:
- Carolyn Gramling, “Cold War–era spy satellite images show Himalayan glaciers are melting fast – Declassified photos and NASA data provide a picture of accelerating ice loss,” 19 June 2019, Sciencenews website at: https://www.sciencenews.org/article/cold-war-spy-satellite-images-himalayan-glaciers-rapid-melting
Discovering archaeological sites:
- Geoff Manaugh, “Archaeologists Are Spotting Ancient Ruins in Cold War Spy Photos,” The Atlantic, 23 June 2016; https://www.theatlantic.com/technology/archive/2016/06/among-the-remnants/488279/
- Jesse Casana, David Goodman & Carolin Ferwerda, “A wall or a road? A remote sensing-based investigation of fortifications on Rome’s eastern frontier,” Cambridge University Press, 26 October 2023: https://www.cambridge.org/core/journals/antiquity/article/wall-or-a-road-a-remote-sensingbased-investigation-of-fortifications-on-romes-eastern-frontier/8FE59FB0D5476EA329614EEC6DC414FD
- Elizabeth Howell, “Declassified spy satellite images reveal 400 Roman Empire forts in the Middle East,” Space.com, 26 October 2023: https://www.space.com/spy-satellite-images-declassified-roman-empire-forts-discovered
- Andrew Curry, “Spy photos of Syrian desert reveal ancient Roman forts,” Science, 25 October 2023: https://www.science.org/content/article/spy-photos-syrian-desert-reveal-ancient-roman-forts