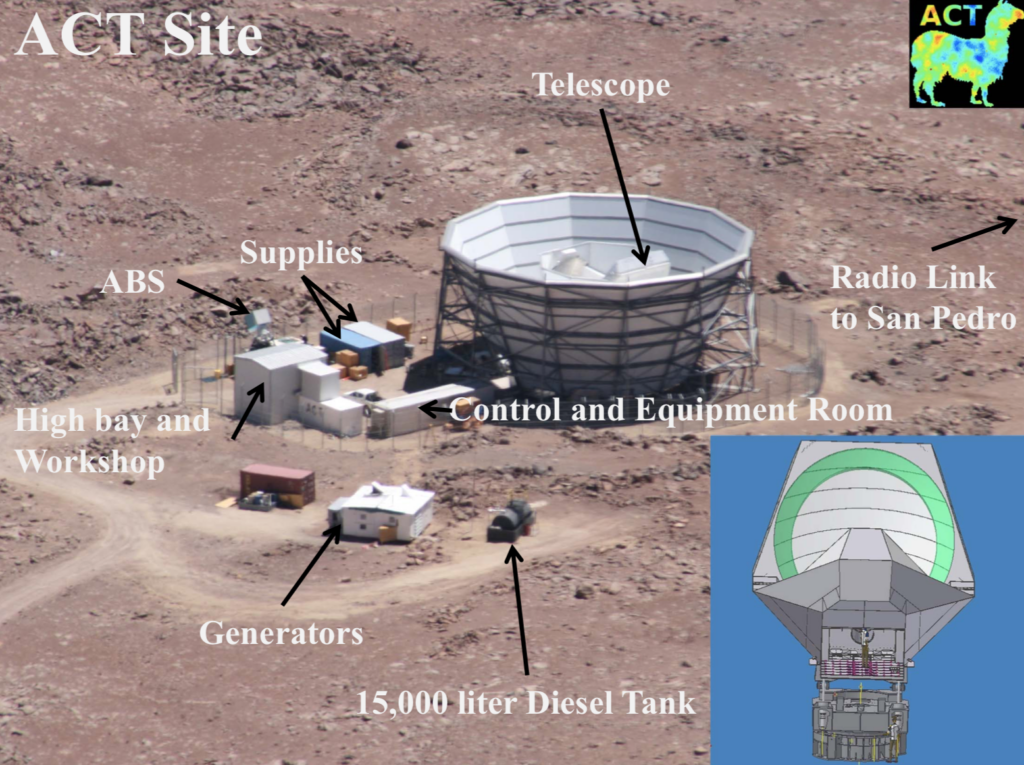
The Atacama Cosmology Telescope (ACT) is a six-meter (19.7 foot) radio telescope designed to make high-resolution, microwave-wavelength surveys of the cosmic microwave background (CMB). It is located at a remote site in the Atacama Desert at an elevation of 5,190 meters (17,030 feet) in northern Chile.
The ACT site. Source: ACT Collaboration
ACT observes in three frequency bands (148, 218 and 277 GHz) and has a resolution of 1.3 arc minutes at 148 GHz, near the peak of the CMB spectrum. This is significantly higher than the 5-10 arc minute resolution of the Planck spacecraft, which observed the CMB from 2009 to 2013 in the frequency range from 30 to 857 GHz. You’ll find a detailed description of the Atacama Cosmology Telescope (ACT) at the following link: https://www.cosmos.esa.int/documents/387566/387653/Ferrara_Dec3_09h20_Devlin_ACT.pdf
New results from the ACT survey, reported in December 2020, affirm the Planck CMB survey results.
The universe is isotropic
The estimate of the age of the universe was refined to 13.77 billion years old ± 0.04 billion years, overlapping uncertainty bands with the 2015 Planck estimate of 13.813 ± 0.038 billion years
The value of the Hubble constant was refined to 67.6 kilometers / second / megaparsec, up slightly from the 2018 Planck estimate of 67.4 kilometers / second / megaparsec. The significant difference from the value derived from astrophysical measurements, 73.5 km / second / megaparsec, remains unexplained.
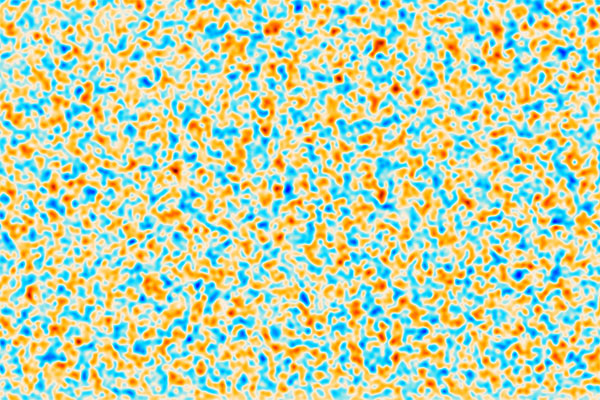
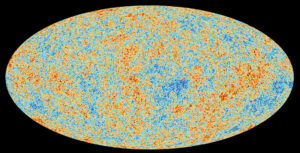
ACT high resolution image of the isotropic cosmic background radiation covering a section of the sky 50 times the width of a full moon. This image represents a region of space 20 billion light-years across. Source: ACT Collaboration via EarthSky
For more information:
S.K. Choi, et al., “The Atacama Cosmology Telescope: a measurement of the Cosmic Microwave Background power spectra at 98 and 150 GHz,” Journal of Cosmology and Astroparticle Physics (subscription required), Volume 2020, December 2020: https://iopscience.iop.org/article/10.1088/1475-7516/2020/12/045/pdf
The US Laser Interferometer Gravitational-Wave Observatory (LIGO) began its third “observing run,” O3, on 1 April 2019 after a series of upgrades were completed on both LIGO instruments (in Hanford, Washington and Livingston, Louisiana) during an 18-month shutdown period after the second observing run, O2, ended on 25 August 2017. The European Gravitational Observatory’s (EGO) Virgo instrument also joined O3. Since its last observing run, which coincided with part of LIGO O2, Virgo also received a series of upgrades that have almost doubled its sensitivity. O3 is scheduled to last for one calendar year. Check out the details of these gravitational wave instruments and O3 at the following websites:
“By July 31st, 2019, LIGO had sent out 25 alerts to possible detections, three have since been retracted, leaving us with 22 ‘candidate’ gravitational wave events. We call them “candidates” because we still need time to vet all of them. If all candidates are verified, then the number of detections made by LIGO in just the first third of O3 will double the number of detections made in its first two runs combined……So far, no electromagnetic counterparts related to our public alerts have been observed, but all candidates are being actively analyzed by LSC/Virgo science teams.”
As of July 31, 2019 LIGO/Virgo had seen:
18 binary black hole merger candidates
4 binary neutron star merger candidates
The LIGO-Virgo Collaboration has created the Gravitational Wave Candidate Event Database (GraceDB), which members of the public can access to track observations made during O3 here:
On 14 August 2019, the LIGO and Virgo instruments detected a gravitational wave event that appears to have come from a previously undetected source: the collision of a black hole and a neutron star. This event, tentatively identified as S190814bv, is estimated to have occurred about 900 million light-years away. Data from the three detectors enabled scientists to locate the source of these gravitational waves to a 23 square degree region of the sky, which would be about seven times the diameter of the Moon as seen from Earth. While the gravitational wave signal was characterized as “remarkably strong,” so far, there have been no “multi-messenger” detections in the electromagnetic spectrum to help further refine the location and the nature of the event.
You’ll find a description of a black hole collision with a neutron star on the Simulating eXtreme Spacetimes (SXS) website at the following link:
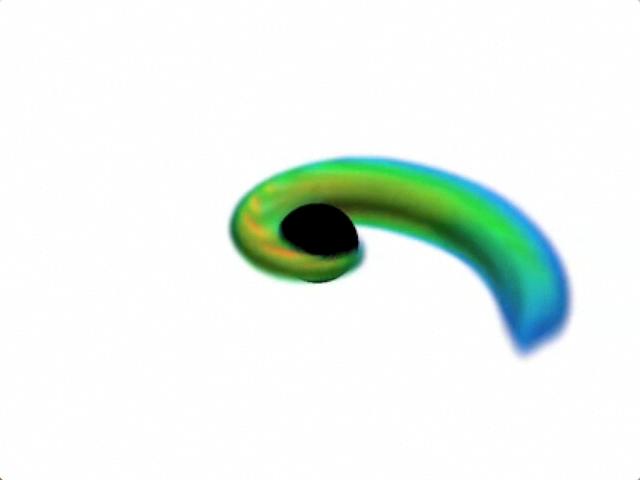
Here, SXS offers the following sequence of events for this exotic collision.
Neutron star beginning to disrupt. The tidal forces of the black hole squeeze the star like a tube of toothpaste. The distance between the neutron star and the black hole is about 50 km, and they are orbiting hundreds of times per second.Source: SXS
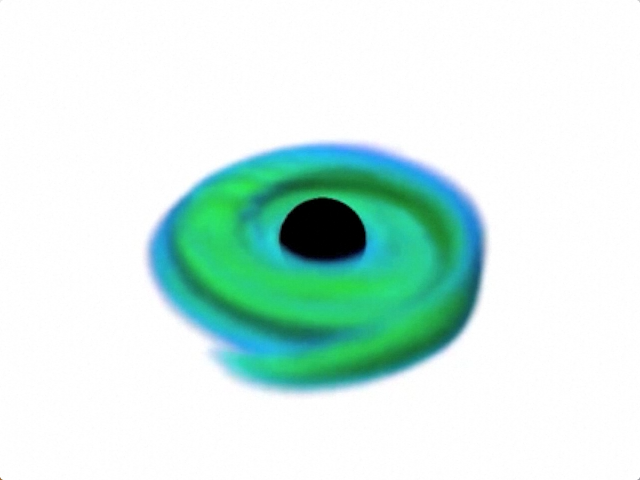
Ejected tail flinging off into space. This matter will eventually contribute rare heavy elements to the interstellar medium.Source: SXS
Accretion disk swirling around the black hole. The accretion disk survives outside the black hole for less than a second. But this is enough time to release an enormous amount of energy in the form of neutrinos. It spans a little more than a hundred km from side to side. Source: SXS
For more information, check the LIGO and Virgo websites for their news updates.
Peter Lobner, updated 7 April 2020 & 19 January 2024
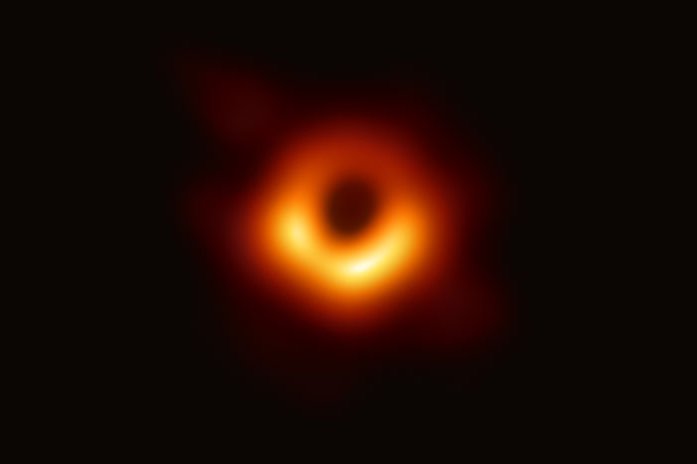
The first image of a black hole was released on 10 April 2019 at a press conference in Washington D.C. held by the Event Horizon Telescope (EHT) team and the National Science Foundation (NSF). The subject of the image is the supermassive black hole known as M87* located near the center of the Messier 87 (M87) galaxy. This black hole is about 55 million light years from Earth and is estimated to have a mass 6.5 billion times greater than our Sun. The image shows a glowing circular emission ring surrounding the dark region (shadow) containing the black hole. The brightest part of the image also may have captured a bright relativistic jet of plasma that appears to be streaming away from the black hole at nearly the speed of light, beaming generally in the direction of Earth.
The first ever image showing the shadow of a black hole (M87*), which remains unseen at the center of the dark circular region. Source:The EHT Collaboration, et al.
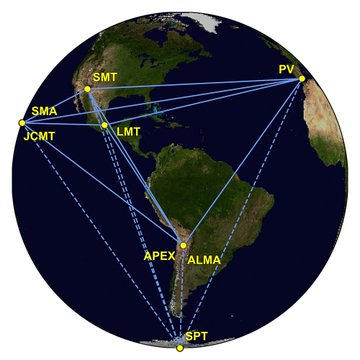
The EHT is not one physical telescope. Rather, it an array of millimeter and sub-millimeter wavelength radio telescopes located around the world. The following map shows the eight telescopes that participated in the 2017 observations of M87. Three additional telescopes joined the EHT array in 2018 and later.
The EHT array as used for the April 2017 observations. Source: The EHT Collaboration, et al.
All of the EHT telescopes are used on a non-dedicated basis by an EHT team of more than 200 researchers during a limited annual observing cycle. The image of the M87* black hole was created from observations made during a one week period in April 2017.
The long baselines between the individual radio telescopes give the “synthetic” EHT the resolving power of a physical radio telescope with a diameter that is approximately equal to the diameter of the Earth. A technique called very long-baseline interferometry (VLBI) is used to combine the data from the individual telescopes to synthesize the image of a black hole. EHT Director, Shep Doeleman, referred to VLBI as “the ultimate in delayed gratification among astronomers.” The magnifying power of the EHT becomes real only when the data from all of the telescopes are brought together and the data are properly combined and processed. This takes time.
At a nominal operating wavelength of about 1.3 mm (frequency of 230 GHz), EHT angular resolution is about 25 microarcseconds (μas), which is sufficient to resolve nearby supermassive black hole candidates on scales that correspond to their event horizons. The EHT team reports that the M87* bright emission disk subtends an angle of 42 ± 3 microarcseconds.
For comparison, the resolution of a human eye in visible light is about 60 arcseconds (1/60thof a degree; there are 3,600 arcseconds in one degree) and the 2.4-meter diameter Hubble Space Telescope has a resolution of about 0.05 arcseconds (50,000 microarcseconds).
You can read five open access papers on the first M87* Event Horizon Telescope results written by the EHT team and published on 10 April 2019 in the Astrophysical Journal Letters here:
Congratulations to the EHT Collaboration for their extraordinary success in creating the first-ever image of a black hole shadow.
7 April 2020 Update: EHT observations were complemented by multi-spectral (multi-messenger) observations by NASA spacecraft
On 10 April 2019, NASA reported on its use of several orbiting spacecraft to observe M87 in different wavelengths during the period of the EHT observation.
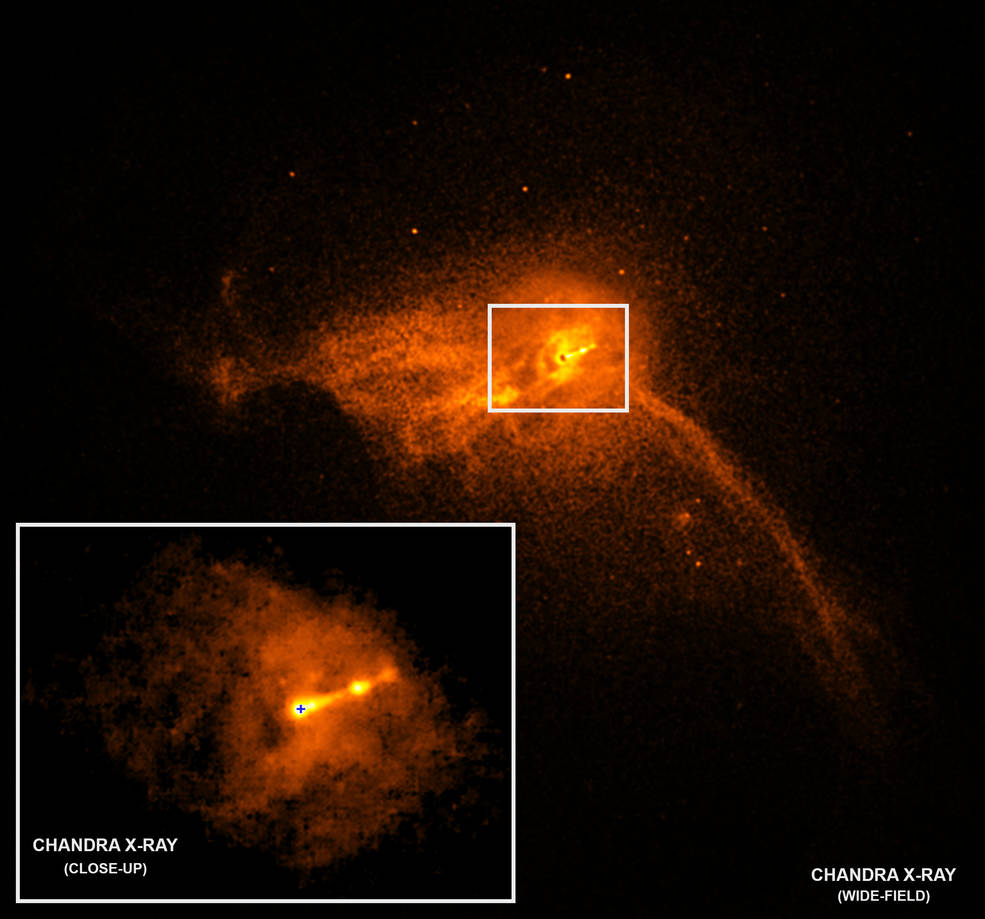
“To complement the EHT findings, several NASA spacecraft were part of a large effort, coordinated by the EHT’s Multiwavelength Working Group, to observe the black hole using different wavelengths of light. As part of this effort, NASA’s Chandra X-ray Observatory, Nuclear Spectroscopic Telescope Array (NuSTAR) and Neil Gehrels Swift Observatory space telescope missions, all attuned to different varieties of X-ray light, turned their gaze to the M87* black hole around the same time as the EHT in April 2017. NASA’s Fermi Gamma-ray Space Telescope was also watching for changes in gamma-ray light from M87* during the EHT observations.”
“NASA space telescopes have previously studied a jet extending more than 1,000 light-years away from the center of M87*. The jet is made of particles traveling near the speed of light, shooting out at high energies from close to the event horizon. The EHT was designed in part to study the origin of this jet and others like it.”
NASA’s Neutron star Interior Composition Explorer (NICER) experiment on the International Space Station also contributed to the multi-spectral observations of M87*, which were coordinated by EHT’s Multiwavelength Working Group.
Chandra X-ray Observatory close-up of the core of the M87 galaxy, showing the location of the M87* black hole (+) and the relativistic jet. Source: NASA/CXC/Villanova University/J. Neilsen
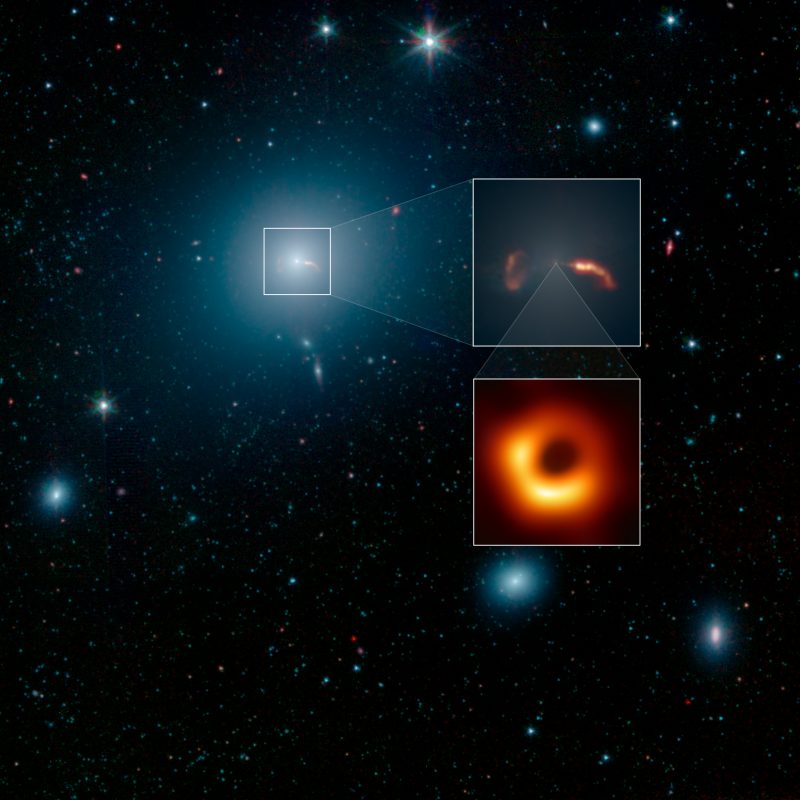
On April 25, 2019, NASA released the following composite image showing the M87 galaxy, the position of the M87* black hole and large relativistic jets of matter being ejected from the black hole. These infrared images were made by NASA’s orbiting Spitzer Space Telescope.
The M87 galaxy, with two expanded views, first showing the location of the M87* black hole and two plasma jets (orange) at the center of the galaxy, and second, the closeup EHT image of the M87* black hole’s shadow. Source: NASA/JPL-Caltech/IPAC/Event Horizon Telescope
19 January 2024 Update: Results of the second M87* black hole EHT observation campaign
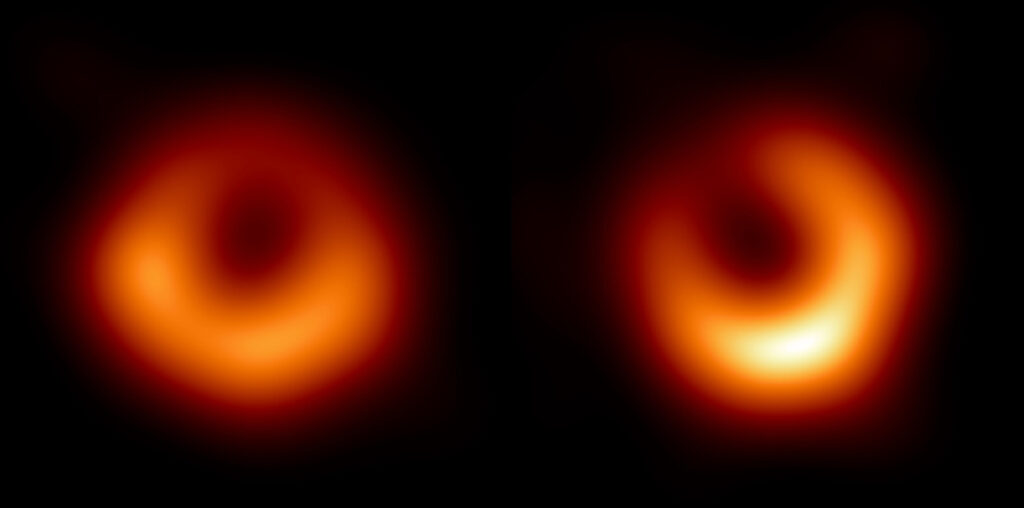
The original image of the M87* black hole released in April 2019 was derived from data collected during the April 2017 EHT observation campaign. In January 2024, the EHT Collaboration published the results of a second M87* black hole observation campaign, which took place in April 2018 with an improved global EHT array, wider frequency coverage, and increased bandwidth. This paper shows that the M87* black hole has maintained a similar size in the two images and that the brightest part of the ring surrounding the black hole has rotated about 30 degrees.
Original M87* black hole image (left) & an image from data collected one year later (right). Source: EHT Collaboration via Astronomy & Astrophysics (Jan 2024)
The EHT Collaboration concluded, “The perennial persistence of the ring and its diameter robustly support the interpretation that the ring is formed by lensed emission surrounding a Kerr black hole with a mass ∼6.5 × 10⁹M⊙ (mass of the Sun). The significant change in the ring brightness asymmetry implies a spin axis that is more consistent with the position angle of the large-scale jet.”
For more information:
See the following sources for more information on the EHT and imaging the M87* black hole:
Since late August 2017, the US LIGO 0bservatories in Washington and Louisiana and the European Gravitational Observatory (EGO), Virgo, in Italy, have been off-line for updating and testing. These gravitational wave observatories were set to start Observing Run 3 (O3) on 1 April 2019 and conduct continuous observations for one year. All three of these gravitational wave observatories have improved sensitivities and are capable of “seeing” a larger volume of the universe than in Observing Run 2 (O2).
Later in 2019, the Japanese gravitational wave observatory, KAGRA, is expected to come online for the first time and join O3. By 2024, a new gravitational wave observatory in India is expected to join the worldwide network.
On the advent of this next gravitational wave detection cycle, here’s is a brief summary of the status of worldwide gravitational wave observatories.
Advanced LIGO
The following upgrades were implemented at the two LIGO observatories since Observing Run 2 (O2) concluded in 2017:
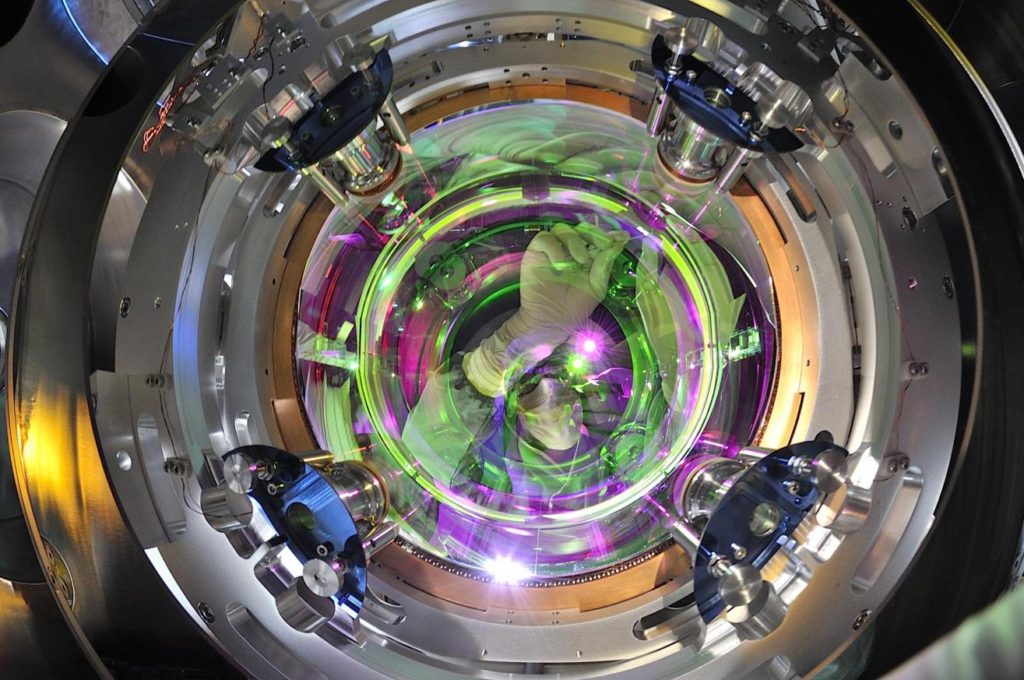
Laser power has been doubled, increasing the detectors’ sensitivity to gravitational waves.
Upgrades were made to LIGO’s mirrors at both locations, with five of eight mirrors being swapped out for better-performing versions.
Upgrades have been implemented to reduce levels of quantum noise. Quantum noise occurs due to random fluctuations of photons, which can lead to uncertainty in the measurements and can mask faint gravitational wave signals. By employing a technique called quantum “squeezing” (vacuum squeezing), researchers can shift the uncertainty in the laser light photons around, making their amplitudes less certain and their phases, or timing, more certain. The timing of photons is what is crucial for LIGO’s ability to detect gravitational waves. This technique initially was developed for gravitational wave detectors at the Australian National University, and matured and routinely used since 2010 at the GEO600 gravitational wave detector in Hannover, Germany,
In comparison to its capabilities in 2017 during O2, the twin LIGO detectors have a combined increase in sensitivity of about 40%, more than doubling the volume of the observable universe.
You’ll find more news and information on the LIGO website at the following link:
GEO600 is a modest-size laser interferometric gravitational wave detector (600 meter / 1,969 foot arms) located near Hannover, Germany. It was designed and is operated by the Max Planck Institute for Gravitational Physics, along with partners in the United Kingdom.
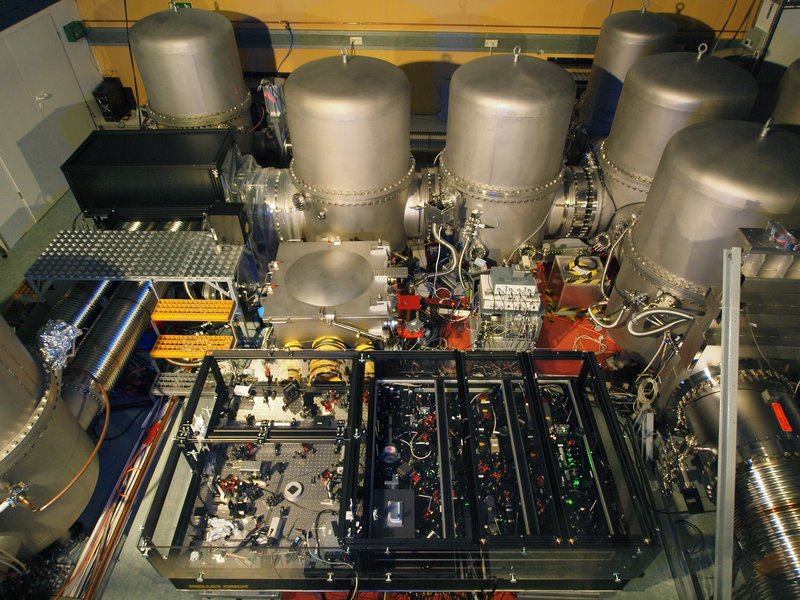
In mid-2010, GEO600 became the first gravitational wave detector to employ quantum “squeezing” (vacuum squeezing) and has since been testing it under operating conditions using two lasers: its standard laser, and a “squeezed-light” laser that just adds a few entangled photons per second but significantly improves the sensitivity of GEO600. In a May 2013 paper entitled, “First Long-Term Application of Squeezed States of Light in a Gravitational Wave Observatory,” researchers reported the following results of operational tests in 2011 and 2012.
“During this time, squeezed vacuum was applied for 90.2% (205.2 days total) of the time that science-quality data were acquired with GEO600. A sensitivity increase from squeezed vacuum application was observed broadband above 400 Hz. The time average of gain in sensitivity was 26% (2.0 dB), determined in the frequency band from 3.7 to 4.0 kHz. This corresponds to a factor of 2 increase in the observed volume of the Universe for sources in the kHz region (e.g., supernovae, magnetars).”
The installed GEO600 squeezer (in the foreground) inside the GEO600 clean room together with the vacuum tanks (in the background). Source: http://www.geo600.org/15581/1-High-Tech
While GEO600 has conducted observations in coordination with LIGO and Virgo, GEO600 has not reported detecting gravitational waves. At high frequencies GEO600 sensitivity is limited by the available laser power. At the low frequency end, the sensitivity is limited by seismic ground motion.
You’ll find more information on GEO600 at the following link:
Advanced Virgo, the European Gravitational Observatory (EGO)
At Virgo, the following upgrades were implemented since Observing Run 2 (O2) concluded in 2017:
The steel wires used during O2 observation campaign to suspend the four main mirrors of the interferometer have been replaced. The 42 kg (92.6 pound) mirrors now are suspended with thin fused-silica (glass) fibers, which are expected to increase the sensitivity in the low-medium frequency region. The mirrors in Advanced LIGO have been suspended by similar fused-silica fibers since those two observatories went online in 2015.
A more powerful laser source has been installed, which should improve sensitivity at high frequencies.
Quantum “squeezing” has been implemented in collaboration with the Albert Einstein Institute in Hannover, Germany. This should improve the sensitivity at high frequencies.
Virgo mirror suspension with fused-silica fibers. Source: EGO/Virgo Collaboration/Perciballi
In comparison to its capabilities in 2017 during O2, Virgo sensitivity has been improved by a factor of about 2, increasing the volume of the observable universe by a factor of about 8.
You’ll find more information on Virgo at the following link:
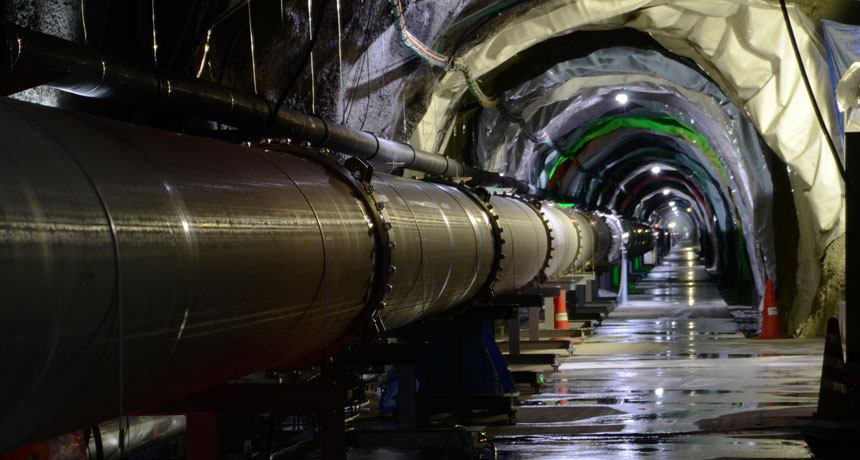
KAGRA is a cryogenically-cooled laser interferometer gravitational wave detector that is sited in a deep underground cavern in Kamioka, Japan. This gravitational wave observatory is being developed by the Institute for Cosmic Ray Research (ICRR) of the University of Tokyo. The project website is at the following link:
One leg of the KAGRA interferometer. Source: ICRR, University of Tokyo
The cryogenic mirror cooling system is intended to cool the mirror surfaces to about 20° Kelvin (–253° Celsius) to minimize the motion of molecules (jitter) on the mirror surface and improve measurement sensitivity. KAGRA’s deep underground site is expected to be “quieter” than the LIGO and VIRGO sites, which are on the surface and have experienced effects from nearby vehicles, weather and some animals.
The focus of work in 2018 was on pre-operational testing and commissioning of various systems and equipment at the KAGRA observatory. In December 2018, the KAGRA Scientific Congress reported that, “If our schedule is kept, we expect to join (LIGO and VIRGO in) the latter half of O3…” You can follow the latest news from the KAGRA team here:
IndIGO, the Indian Initiative in Gravitational-wave Observations, describes itself as an initiative to set up advanced experimental facilities, with appropriate theoretical and computational support, for a multi-institutional Indian national project in gravitational wave astronomy. The IndIGO website provides a good overview of the status of efforts to deploy a gravitational wave detector in India. Here’s the link:
On 22 January 2019, T. V. Padma reported on the Naturewebsite that India’s government had given “in-principle” approval for a LIGO gravitational wave observatory to be built in the western India state of Maharashtra.
“India’s Department of Atomic Energy and its Department of Science and Technology signed a memorandum of understanding with the US National Science Foundation for the LIGO project in March 2016. Under the agreement, the LIGO Laboratory — which is operated by the California Institute of Technology (Caltech) in Pasadena and the Massachusetts Institute of Technology (MIT) in Cambridge — will provide the hardware for a complete LIGO interferometer in India, technical data on its design, as well as training and assistance with installation and commissioning for the supporting infrastructure. India will provide the site, the vacuum system and other infrastructure required to house and operate the interferometer — as well as all labor, materials and supplies for installation.”
India’s LIGO observatory is expected to cost about US$177 million. Full funding is expected in 2020 and the observatory currently is planned for completion in 2024. India’s Inter-University Centre for Astronomy and Astrophysics (IUCAA), also in Maharashtra state, will lead the project’s gravitational-wave science and the new detector’s data analysis.
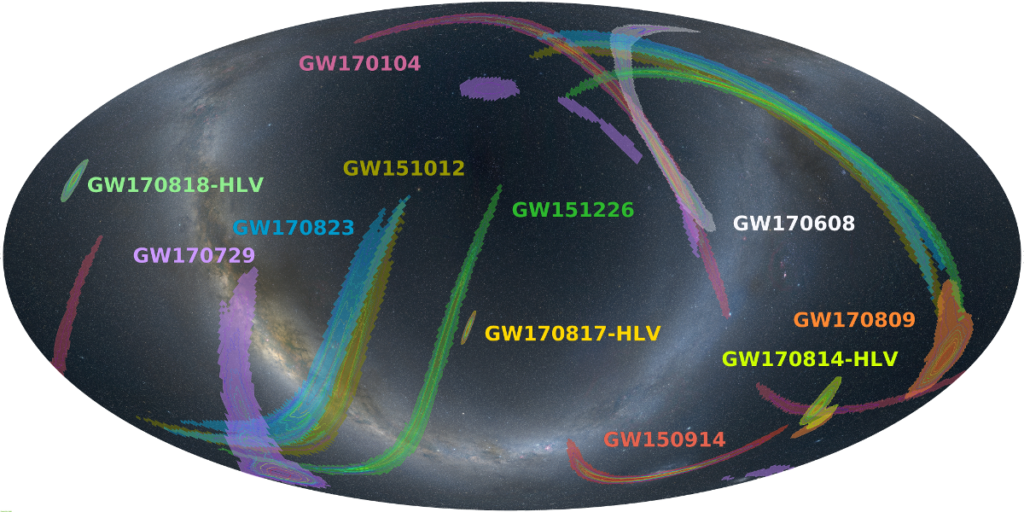
Using only the two US LIGO detectors, it is not possible to localize the source of gravitational waves beyond a broad sweep through the sky. On 1 August 2017, Virgo joined LIGO during the second Observation Run, O2. While the LIGO-Virgo three-detector network was operational for only three-and-a-half weeks, five gravitational wave events were observed. As shown in the following figure, the spatial resolution of the source was greatly improved when a triple detection was made by the two LIGO observatories and Virgo. These events are labeled with the suffix “HLV”.
Source: http://www.virgo-gw.eu, 3 December 2018
The greatly reduced areas of the triple event localizations demonstrate the capabilities of the current global gravitational wave observatory network to resolve the source of a gravitational-wave detection. The LIGO and Virgo Collaboration reports that it can send Open Public Alerts within five minutes of a gravitational wave detection.
With timely notification and more precise source location information, other land-based and space observatories can collaborate more rapidly and develop a comprehensive, multi-spectral (“multi-messenger”) view of the source of the gravitational waves.
When KAGRA and LIGO-India join the worldwide gravitational wave detection network, it is expected that source localizations will become 5 to 10 times more accurate than can be accomplished with just the LIGO and Virgo detectors.
For more background information on gravitational-wave detection, see the following Lyncean posts:
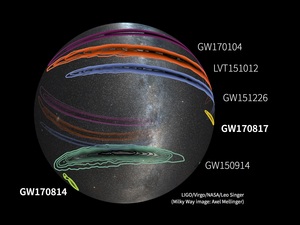
The Laser Interferometer Gravitational-Wave Observatory (LIGO) in the U.S. reported the first ever detection of gravitational waves on 14 September 2015 and, to date, has reported three confirmed detections of gravitational waves originating from black hole coalescence events. These events and their corresponding LIGO press releases are listed below.
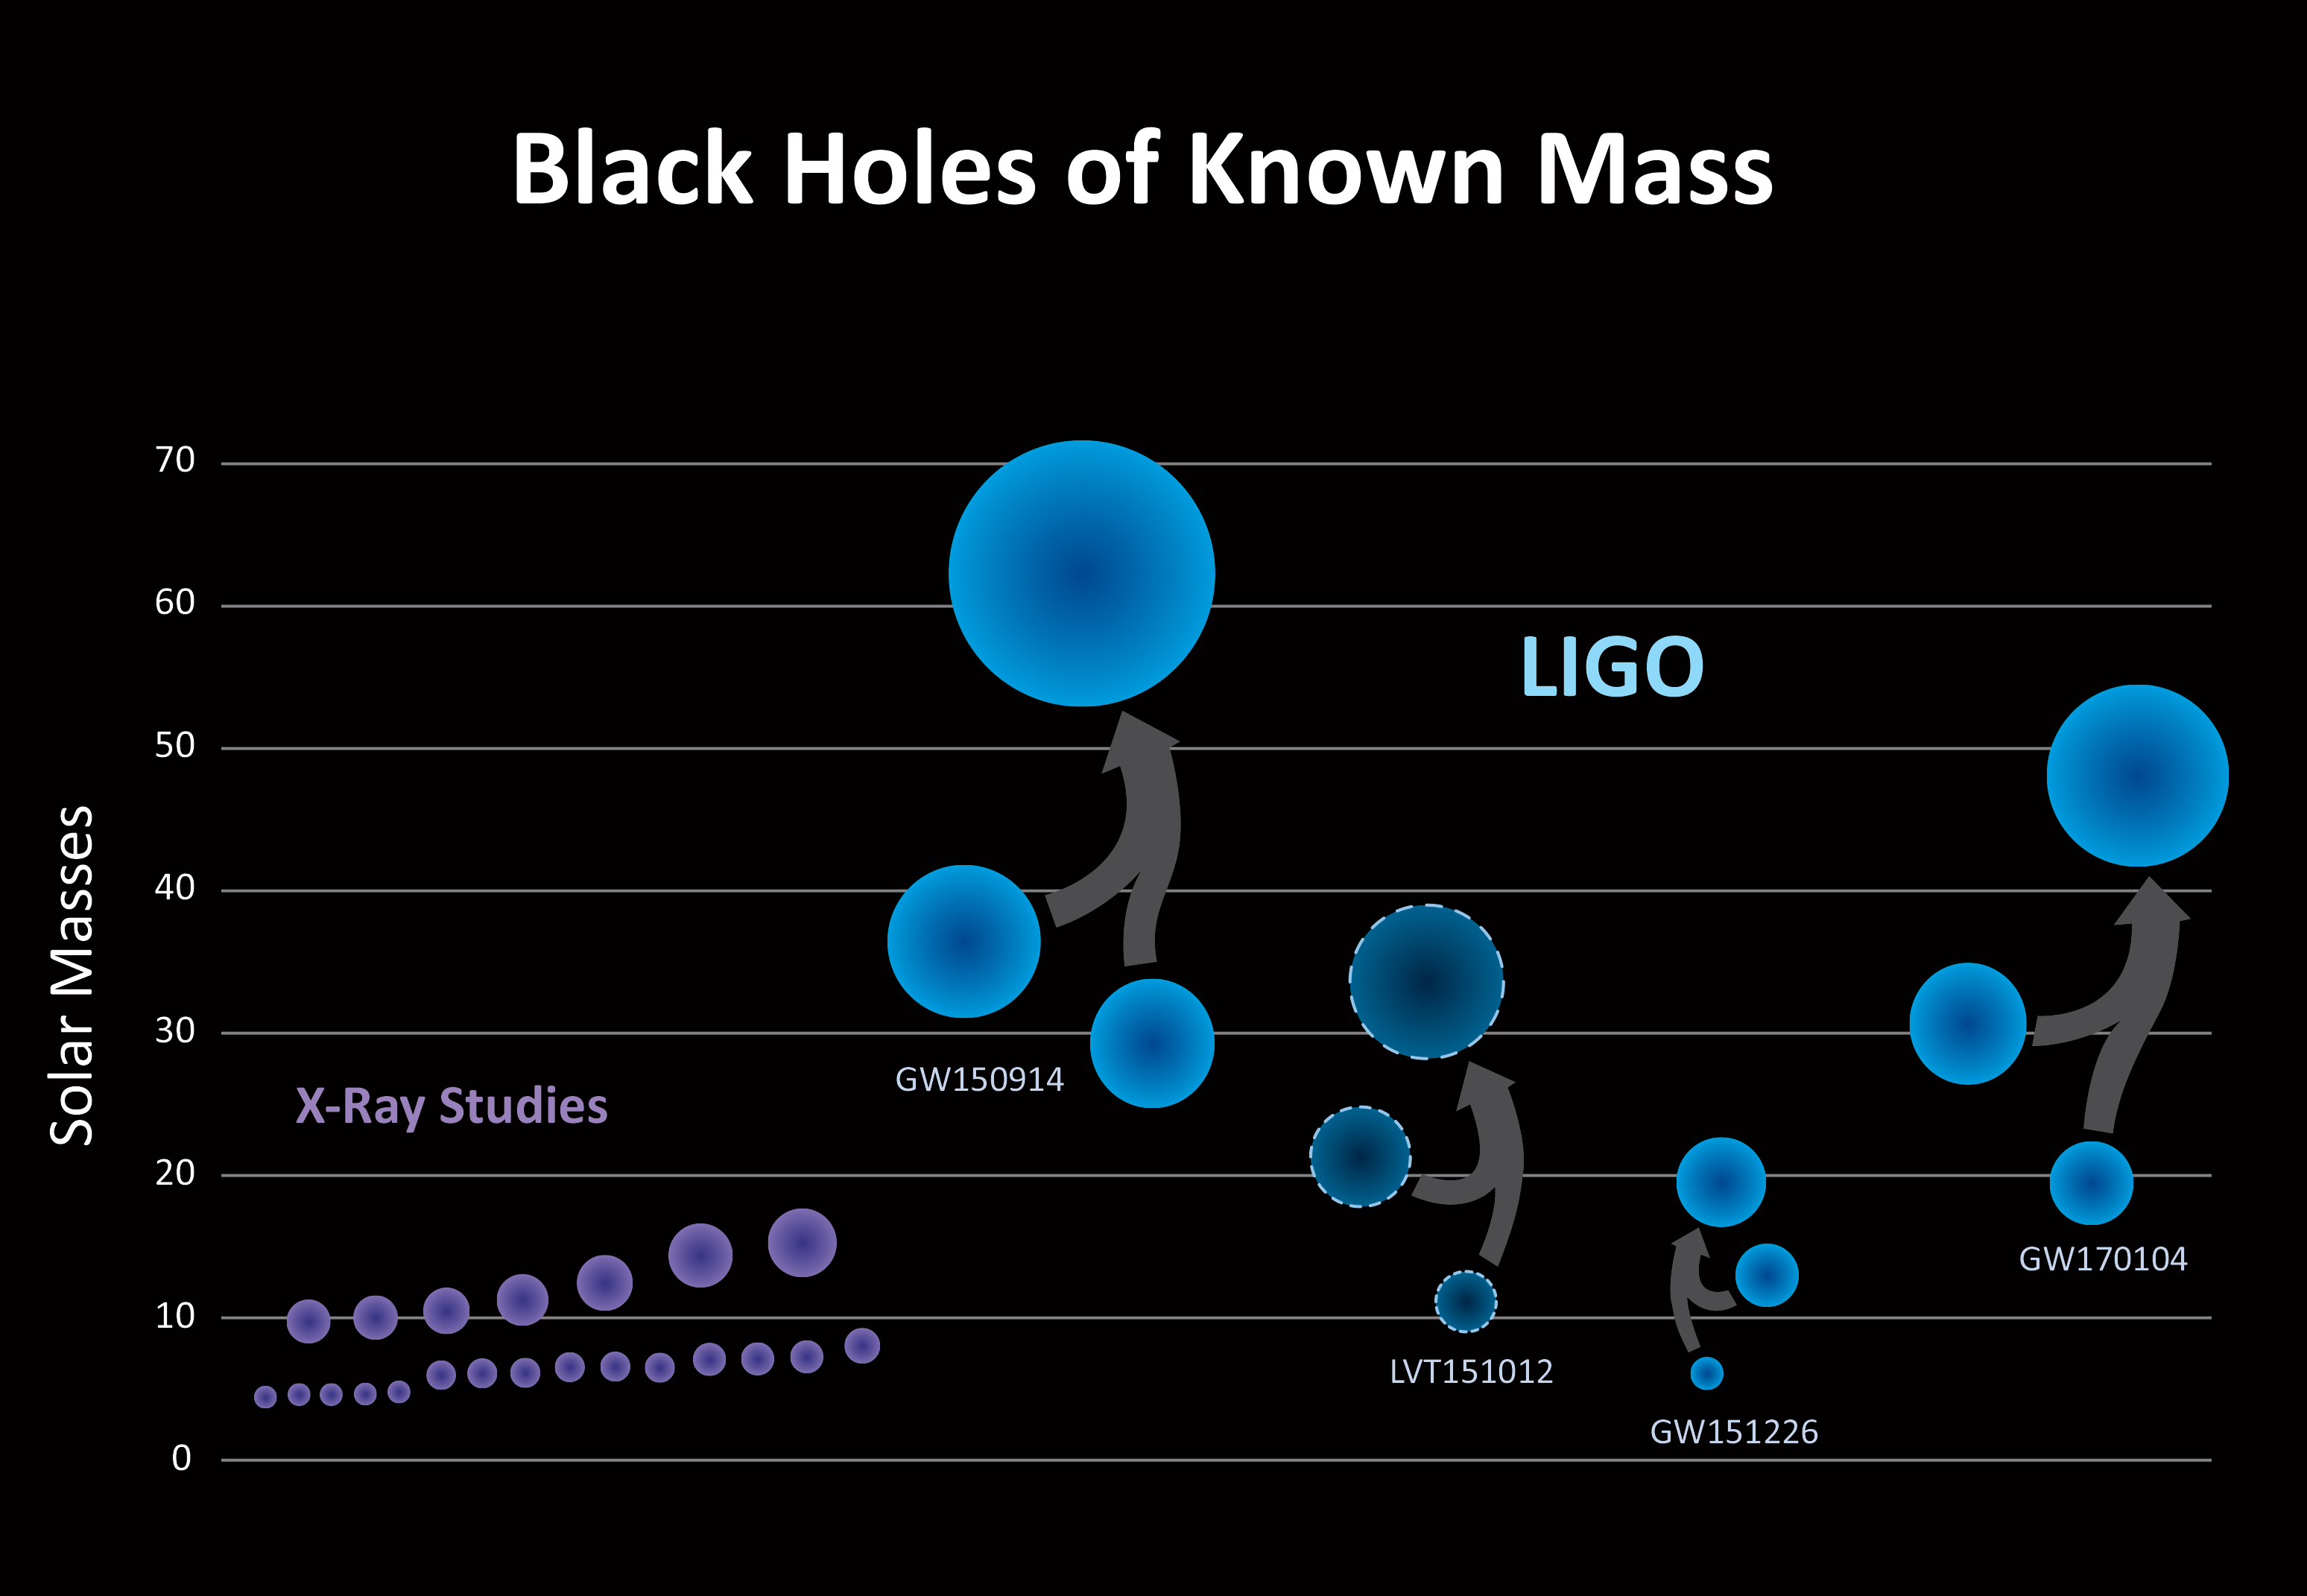
The following figure illustrates how these black hole coalescence events compare to our knowledge of the size of black holes based on X-ray observations. The LIGO team explained:
“LIGO has discovered a new population of black holes with masses that are larger than what had been seen before with X-ray studies alone (purple). The three confirmed detections by LIGO (GW150914, GW151226, GW170104), and one lower-confidence detection (LVT151012), point to a population of stellar-mass binary black holes that, once merged, are larger than 20 solar masses—larger than what was known before.”
Image credit: LIGO/Caltech/MIT/Sonoma State (Aurore Simonnet)
On 1 August 2017, the Advanced VIRGO detector at the European Gravitational Observatory (EGO) in Cascina, Italy (near Pisa) became operational, using wire suspensions for its interferometer mirrors instead of the fragile glass fiber suspensions that had been delaying startup of this detector.
On 17 August 2017, the LIGO – VIRGO team reported the detection of gravitational waves from a new source; a collision of two neutron stars. In comparison to black holes, neutron stars are low-mass objects, yet the neutron star collision was able to generate gravitational waves that were strong enough and in the detection frequency range of the LIGO and VIRGO. You’ll find the LIGO press release for that event, GW170817, at the following link.
The following figure from this press release illustrates the limits of localizing the source of a gravitational wave using the gravitational wave detectors themselves. The localization of GW180817 was much better than the previous gravitational wave detections because the detection was made by both LIGO and VIRGO, which have different views of the sky and a very long baseline, allowing coarse triangulation of the source.
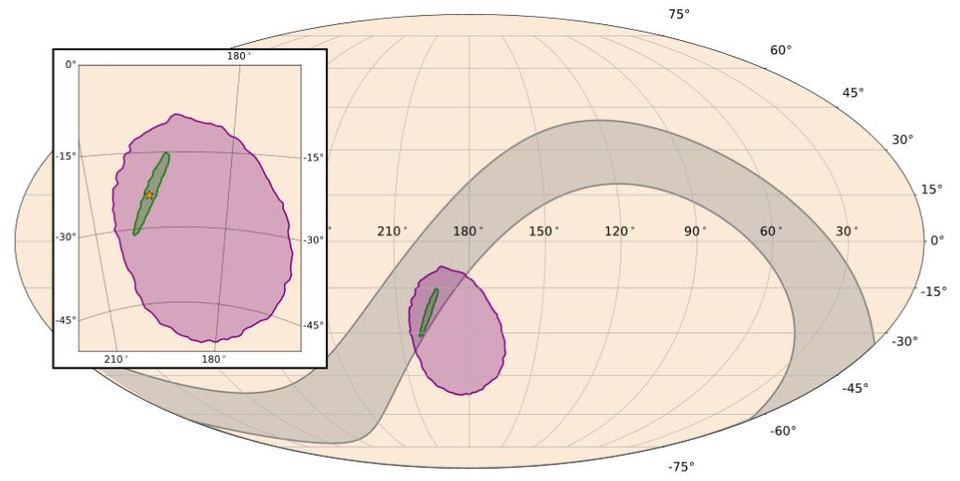
Unlike the previous gravitational wave detections from black hole coalescence, the neutron star collision that produced GW180817 also produced other observable phenomena. Gravitational waves were observed by LIGO and VIRGO, allowing coarse localization to about 31 square degrees in the sky and determination of the time of the event. The source of a two-second gamma ray burst observed at the same time by the Fermi and INTEGRAL gamma ray space telescopes (in Earth orbit) overlapped with the region of the sky identified by LIGO and VIRGO. An optical transient (the afterglow from the event) in that overlap region was first observed hours later by the 1 meter (40 inch) Swope Telescope on Cerro Las Campanas in Chile. The results of this localization process is shown below and is described in more detail in the following LIGO press release:
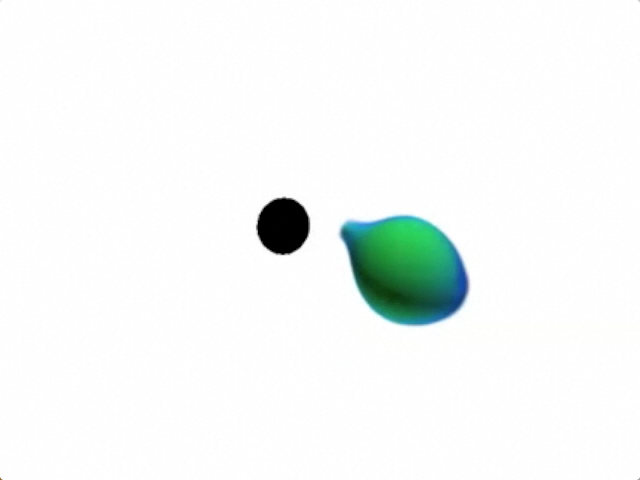
The sky map created by LIGO-Virgo (green) showing the possible location of the source of gravitational waves, compared with regions containing the location of the gamma ray burst source from Fermi (purple) and INTEGRAL (grey). The inset shows the actual position of the galaxy (orange star) containing the “optical transient” that resulted from the merger of two neutron stars (Credit: NASA/ESO)
The specific source initially was identified optically as a brilliant blue dot that appeared to be in a giant elliptical galaxy. A multi-spectral “afterglow” persisted at the source for several weeks, during which time the source became a dim red point if light. Many observatories were involved in detailed observations in the optical and infra-red ranges of the spectrum.
Important findings relate to the formation of large quantities of heavy elements (i.e., gold to uranium) in the aftermath of this event, which is known as a “kilonova.” This class of events likely plays an important role in seeding the universe with the heaviest elements, which are not formed in ordinary stars or novae. You’ll find more details on this matter in Lee Billing’s article, “Gravitational Wave Astronomers Hit the Mother Lode,” on the Scientific American website at the following link:
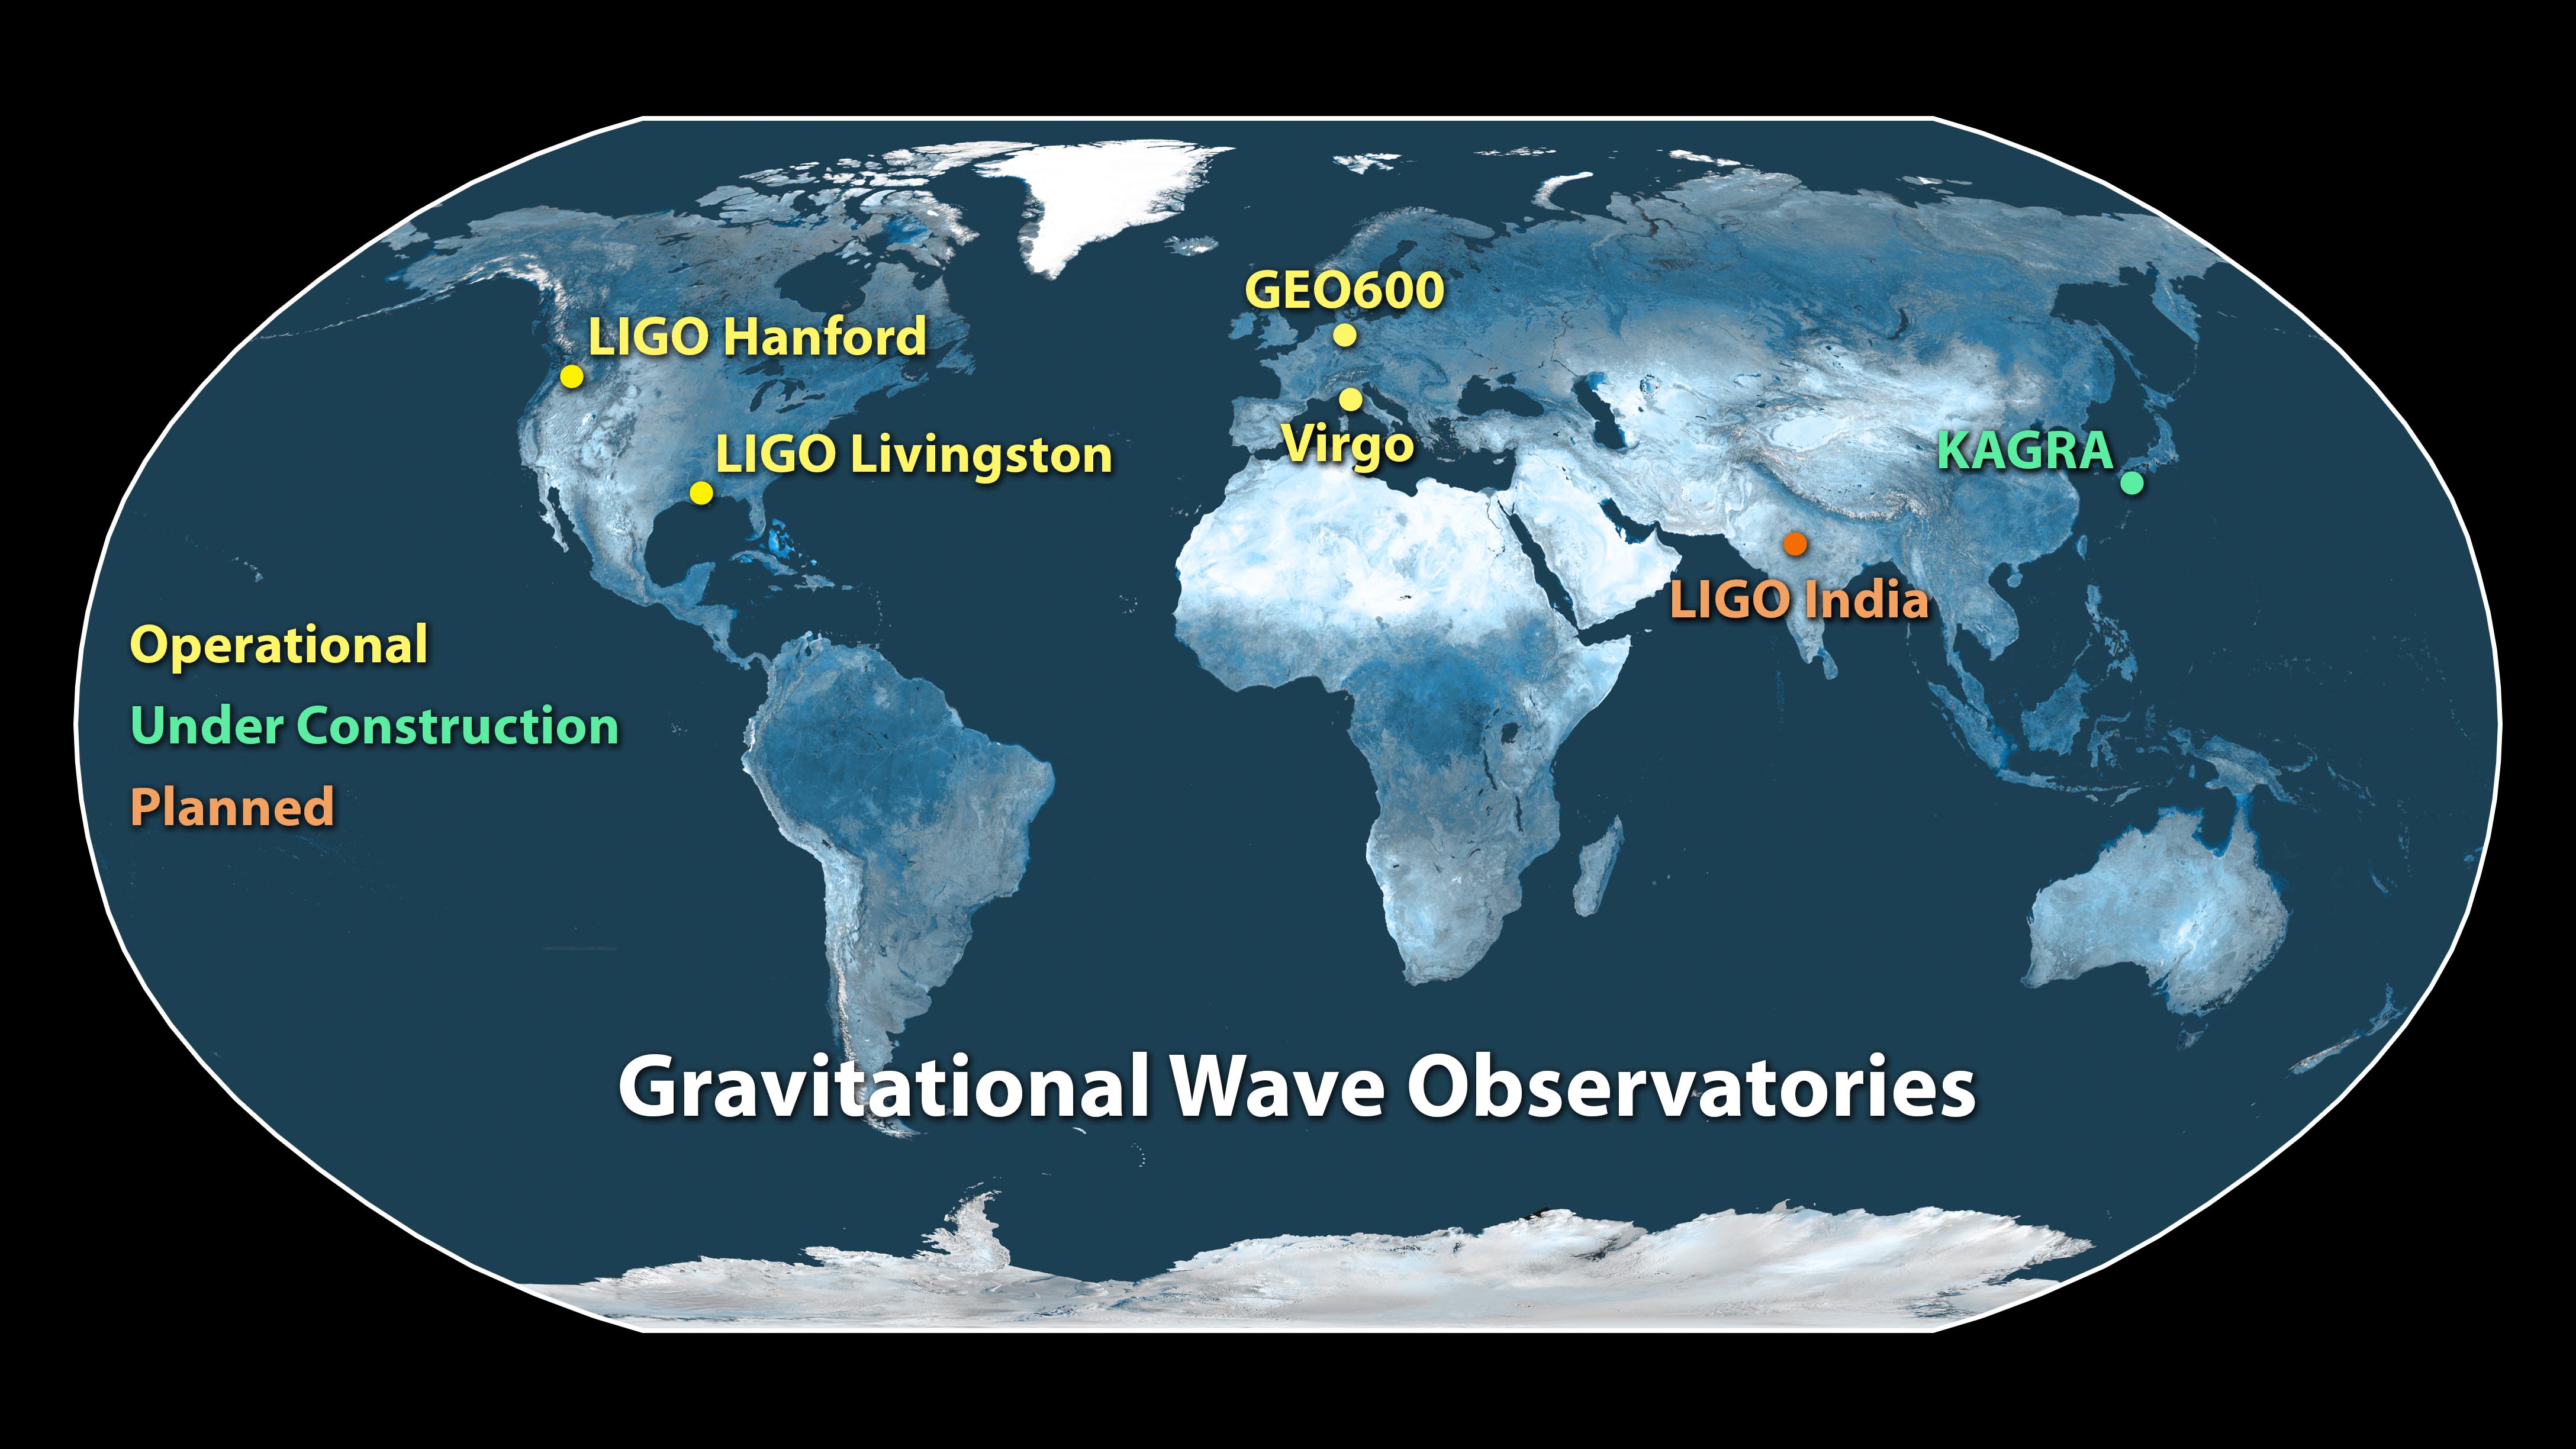
The ability to localize gravitational wave sources will improve as additional gravitational wave detectors become operational and capabilities of existing detectors continue to be improved. The current status of worldwide gravitational wave detector deployment is shown in the following figure.
Source: LIGO
The ability to take advantage of “multi-messenger” (multi-spectral) observations will depend on the type of event and timely cueing of observatories worldwide and in orbit. The success of the GW170817 detection and subsequent multi-spectral observations of “kilonova” demonstrates the rich scientific potential for such coordinated observations
Utrecht University (Netherlands) Professor Gerard ’t Hooft was the first to propose the “holographic principle,” in which all information about a volume of space can be thought of as being encoded on a lower-dimensional “boundary” of that volume.
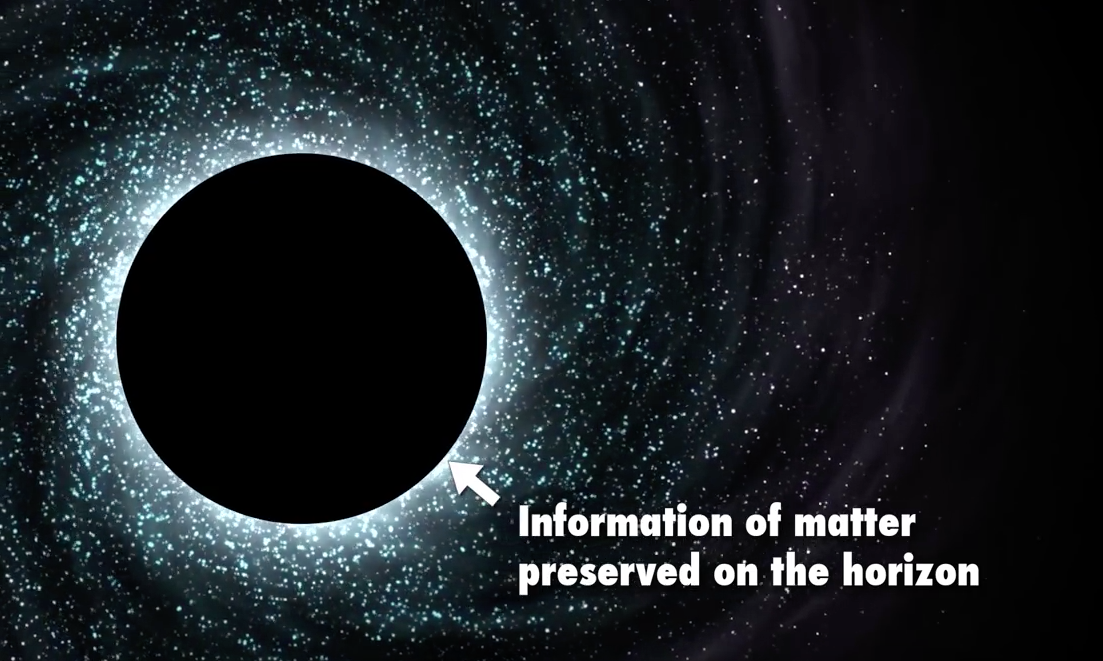
Stanford Professor Leonard Susskind was one of the founders of string theory and, in 1995, developed the first string theory interpretation of the holographic principle to black holes. Dr. Susskind’s analysis showed that, consistent with quantum theory, information is not lost when matter falls into a black hole. Instead, it is encoded on a lower-dimensional “boundary” of the black hole, namely the event horizon.
Source: screenshot from video, “Is the Universe a Hologram?”
Extending the holographic principle to the universe as a whole, a lower-dimensional “boundary,” or “cosmic horizon,” around the universe can be thought of as a hologram of the universe. Quantum superposition suggests that this hologram is indistinguishable from the volume of space within the cosmic horizon.
You can see a short (15:49 minute) 2015 video interview of Dr. Susskind, “Is The Universe A Hologram?” at the following link:
If you have the time, also check out the longer (55:26) video lecture by Dr. Susskind entitled, “Leonard Susskind on The World As Hologram.” In this video, he explains the meaning of “information” and how information on an arbitrary volume of space can be encoded in one less dimension on a surface surrounding the volume.
You also might enjoy the more detailed story in Dr. Susskind’s 2008 book, “The Black Hole War: My Battle with Stephen Hawking to Make the World Safe for Quantum Mechanics.”
Source: Little, Brown and Company
In my 28 September 2016 post, “The Universe is Isotropic,” I reported on a conclusion reached by researchers using data from the Planck spacecraft’s all-sky survey of the cosmic microwave background (CMB). The researchers noted that an anisotropic universe would leave telltale patterns in the CMB. However, these researchers found that the actual CMB shows only random noise and no signs of such patterns.
More recently, a team of researchers from Canada, UK and Italy, also using the Planck spacecraft’s CBM data set, have offered an alternative view that the universe may be a hologram. You’ll find the abstract for the 27 January 2017 original research paper by N. Afshordi, et al., “From Planck Data to Planck Era: Observational Tests of Holographic Cosmology,” in Physical Review Letters at the following link:
“We test a class of holographic models for the very early Universe against cosmological observations and find that they are competitive to the standard cold dark matter model with a cosmological constant (Λ CDM) of cosmology.”
“Competitive” means that neither model disproves the other. So, we have a draw.
If you are a subscriber to Physical Review Letters, you can download the complete paper by N. Afshordi, et al. from the Physical Review Letters site.
On 14 September 2015, the U.S. Laser Interferometer Gravitational-Wave Observatory (LIGO) became the first observatory to detect gravitational waves. With two separate detector sites (Livingston, Louisiana, and Hanford, Washington) LIGO was able to define an area of space from which the gravitational waves, dubbed GW150914, are likely to have originated, but was not able to pinpoint the source of the waves. See my 11 February 2016 post, “NSF and LIGO Team Announce First Detection of Gravitational Waves,” for a summary of this milestone event.
You’ll find a good overview on the design and operation of LIGO and similar laser interferometer gravity wave detectors in the short (9:06) Veratisium video, “The Absurdity of Detecting Gravitational Waves,” at the following link:
The LIGO team reports that the Advanced LIGO detector is optimized for “a range of frequencies from 30 Hz to several kHz, which covers the frequencies of gravitational waves emitted during the late inspiral, merger, and ringdown of stellar-mass binary black holes.”
First observing run (O1) of the Advanced LIGO detector
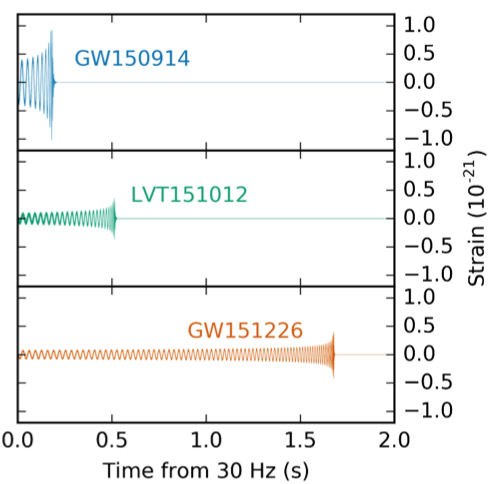
The LIGO team defines O1 as starting on 12 September 2015 and ending on 19 January 2016. During that period, the LIGO team reported that it had, “unambiguously identified two signals, GW150914 and GW151226, with a significance of greater than 5σ,” and also identified a third possible signal, LVT151012. The following figure shows the time evolution of the respective gravitational wave signals from when they enter the LIGO detectors’ sensitive band at 30 Hz.
Source: B. P. Abbot et al., PHYS. REV. X 6, 041015 (2016)
The second detection of gravitational waves, GW151226, occurred on 26 December 2015. You’ll find the 16 June 2016 LIGO press release for this event at the following link:
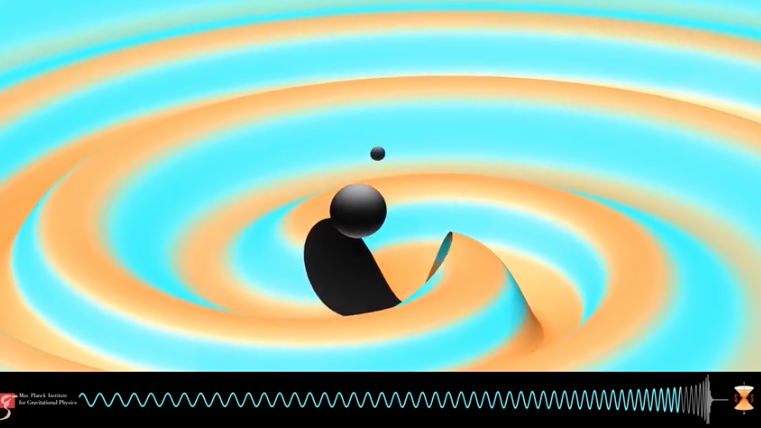
At the following link, you can view a video showing a simulation of GW151226, starting at a frequency of 35 Hz and continuing through the last 55 gravitational-wave cycles before the binary black holes merge:
Source: Max Planck Institute for Gravitational Physics/ Simulating eXtreme Spacetime (SXS) project
In their GW151226 press release, the LIGO team goes out on a limb and makes the following estimate:
“….we can now start to estimate the rate of black hole coalescences in the Universe based not on theory, but on real observations. Of course with just a few signals, our estimate has big uncertainties, but our best right now is somewhere between 9 and 240 binary black hole coalescences per cubic Gigaparsec per year, or about one every 10 years in a volume a trillion times the volume of the Milky Way galaxy!”
More details on the GW151226 detection are available in the paper “GW151266: Observation of Gravitational Waves from a 22-Solar Mass Black Hole Coalescence,” at the following link:
LIGO releases its data to the public. Analyses of the LIGO public data already are yielding puzzling results. In December 2016, researchers reported finding “echoes” in the gravitational wave signals detected by LIGO. If further analysis indicates that the “echoes” are real, they may indicate a breakdown of Einstein’s general theory of relativity at or near the “edge” of a black hole. You can read Zeeya Marali’s 9 December 2016 article, “LIGO black hole echoes hint at general relativity breakdown,” at the following link:
Second observing run (O2) of the Advanced LIGO detector is in progress now
Following a 10-month period when they were off-line for modifications, the Advanced LIGO detectors returned to operation on 30 November 2016 with a 10% improvement in the sensitivity of their interferometers. The LIGO team intends to further improve this sensitivity by a factor of two during the next few years.
VIRGO will add the capability to triangulate the source of gravitational waves
In my 16 December 2015 post, “100th Anniversary of Einstein’s General Theory of Relativity and the Advent of a New Generation of Gravity Wave Detectors,” I reported on other international laser interferometer gravitational wave detectors. The LIGO team has established a close collaboration with their peers at the European Gravitational Observatory, which is located near Pisa, Italy. Their upgraded detector, VIRGO, in collaboration with the two LIGO detectors, is expected to provide the capability to triangulate gravitational wave sources. With better location information on the source of gravitational waves, other observatories can be promptly notified to join the search using other types of detectors (i.e., optical, infrared and radio telescopes).
VIRGO is expected to become operational in 2017, but technical problems, primarily with the mirror suspension system, may delay startup. You’ll find a 16 February 2017 article on the current status of VIRGO at the following link:
Lyncean member Dave Groce recommends the excellent video of an interview of Caltech Professor Kip Thorne (one of the founders of LIGO) by “Einstein” biographer Walter Issacson. This 2 November 2016 video provides a great perspective on LIGO’s first detection of gravitational waves and on the development of gravitational wave detection capabilities. You’ll find this long (51:52) but very worthwhile video at the following link:
Dr. Thorne noted that, at the extremely high sensitivity of the Advanced LIGO detectors, we are beginning to see the effects of quantum fluctuations in “human sized objects,” in particular, the 40 kg (88.2 pound) mirrors in the LIGO interferometers. In each mirror, the center of mass (the average position of all the mass in the mirror) fluctuates due to quantum physics at just the level of the Advanced LIGO noise.
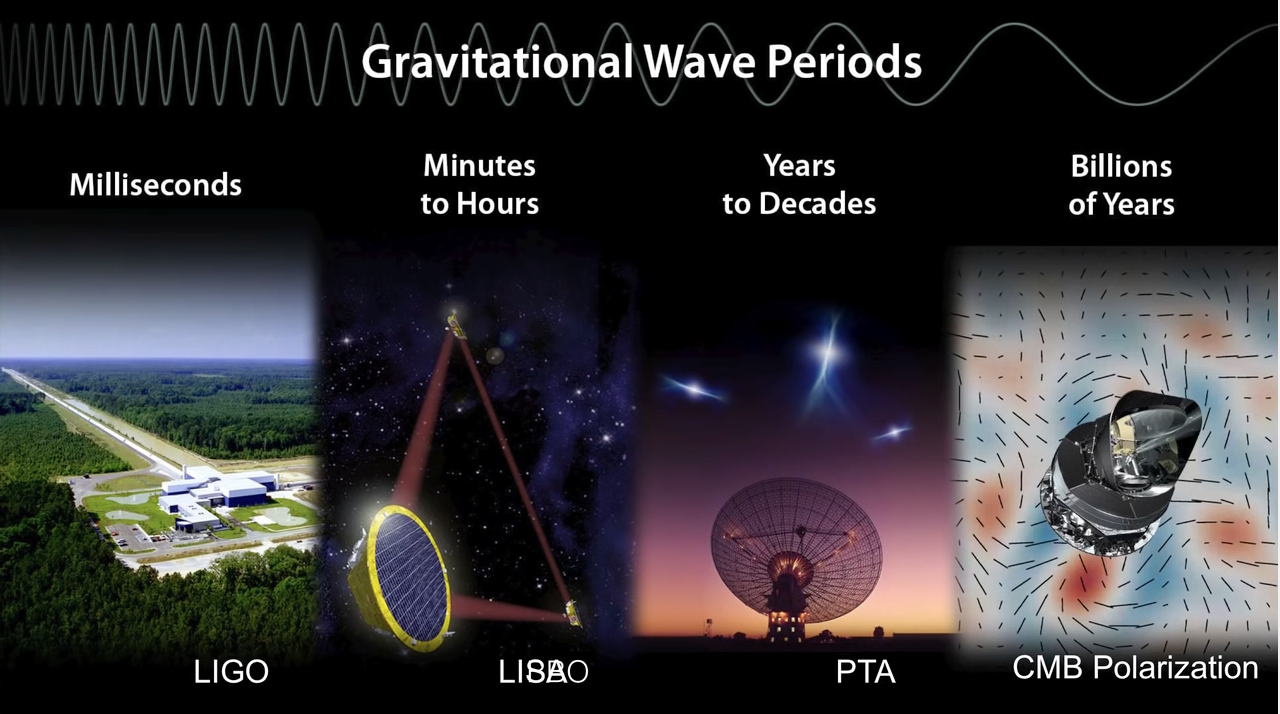
In the interview, Dr. Thorne also discusses several new observatories that will be become available in the following decades to expand the spectrum of gravitational waves that can be detected. These are shown in the following diagram.
Source: screenshot from Kip Thorne / Walter Issacson interview
LISA = Laser Interferometer Space Antenna
PTA = Pulsar Timing Array
CMB = Cosmic microwave background
See my 27 September 2016 post, “Space-based Gravity Wave Detection System to be Deployed by ESA,” for additional information on LISA.
Clearly, we’re just at the dawn of gravitational wave detection and analysis. With the advent of new and upgraded gravitational wave observatories during the next decade, there will be tremendous challenges to align theories with real data. Through this process, we’ll get a much better understanding of our Universe.
In 2010, Prof. Erik Verlinde, University of Amsterdam, Delta Institute for Theoretical Physics, published the paper, “The Origin of Gravity and the Laws of Newton.” In this paper, the author concluded:
“The results of this paper suggest gravity arises as an entropic force, once space and time themselves have emerged. If the gravity and space time can indeed be explained as emergent phenomena, this should have important implications for many areas in which gravity plays a central role. It would be especially interesting to investigate the consequences for cosmology. For instance, the way redshifts arise from entropy gradients could lead to many new insights.
The derivation of the Einstein equations presented in this paper is analogous to previous works, in particular [the 1995 paper by T. Jacobson, ‘Thermodynamics of space-time: The Einstein equation of state.’]. Also other authors have proposed that gravity has an entropic or thermodynamic origin, see for instance [the paper by T. Padmanabhan, ‘Thermodynamical Aspects of Gravity: New insights.’]. But we have added an important element that is new. Instead of only focusing on the equations that govern the gravitational field, we uncovered what is the origin of force and inertia in a context in which space is emerging. We identified a cause, a mechanism, for gravity. It is driven by differences in entropy, in whatever way defined, and a consequence of the statistical averaged random dynamics at the microscopic level. The reason why gravity has to keep track of energies as well as entropy differences is now clear. It has to, because this is what causes motion!”
You can download Prof. Verlinde’s 2010 paper at the following link:
On 8 November 2016, Delta Institute announced that Prof. Verlinde had published a new research paper, “Emergent Gravity and the Dark Universe,” expanding on his previous work. You can read this announcement and see a short video by Prof. Verlinde on the Delta Institute website at the following link:
I found it helpful to start with Section 8, Discussion and Outlook, which is the closest you will find to a layman’s description of the theory.
On the Physics.org website, a short 8 November 2016 article, “New Theory of Gravity Might Explain Dark Matter,” provides a good synopsis of Verlinde’s emergent gravity theory:
“According to Verlinde, gravity is not a fundamental force of nature, but an emergent phenomenon. In the same way that temperature arises from the movement of microscopic particles, gravity emerges from the changes of fundamental bits of information, stored in the very structure of spacetime……
According to Erik Verlinde, there is no need to add a mysterious dark matter particle to the theory……Verlinde shows how his theory of gravity accurately predicts the velocities by which the stars rotate around the center of the Milky Way, as well as the motion of stars inside other galaxies.
One of the ingredients in Verlinde’s theory is an adaptation of the holographic principle, introduced by his tutor Gerard ‘t Hooft (Nobel Prize 1999, Utrecht University) and Leonard Susskind (Stanford University). According to the holographic principle, all the information in the entire universe can be described on a giant imaginary sphere around it. Verlinde now shows that this idea is not quite correct—part of the information in our universe is contained in space itself.
This extra information is required to describe that other dark component of the universe: Dark energy, which is believed to be responsible for the accelerated expansion of the universe. Investigating the effects of this additional information on ordinary matter, Verlinde comes to a stunning conclusion. Whereas ordinary gravity can be encoded using the information on the imaginary sphere around the universe, as he showed in his 2010 work, the result of the additional information in the bulk of space is a force that nicely matches that attributed to dark matter.”
Read the full Physics.org article at the following link:
On 12 December 2016, a team from Leiden Observatory in The Netherlands reported favorable results of the first test of the emergent gravity theory. Their paper, “First Test of Verlinde’s Theory of Emergent Gravity Using Weak Gravitational Lensing Measurements,” was published in the Monthly Notices of the Royal Astronomical Society. The complete paper is available at the following link:
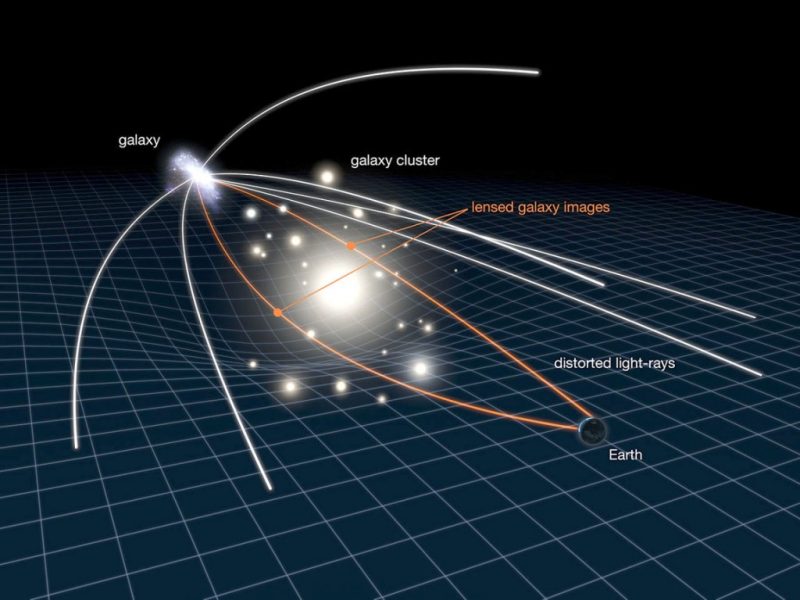
An example of a gravitational lens is shown in the following diagram.
Source: NASA, ESA & L. Calça
As seen from the Earth, the light from the galaxy at the left is bent by the gravitational forces of the galactic cluster in the center, much like light passing though an optical lens.
The Leiden Observatory authors reported:
“We find that the prediction from EG, despite requiring no free parameters, is in good agreement with the observed galaxy-galaxy lensing profiles in four different stellar mass bins. Although this performance is remarkable, this study is only a first step. Further advancements on both the theoretical framework and observational tests of EG are needed before it can be considered a fully developed and solidly tested theory.”
These are exciting times! As noted in the Physics.org article, “We might be standing on the brink of a new scientific revolution that will radically change our views on the very nature of space, time and gravity.”
Richard A. Muller, a professor of physics at the University of California, Berkeley, and Facility Senior Scientist at Lawrence Berkeley Laboratory, is the author of in intriguing new book entitled, “NOW, the Physics of Time.”
Source: W. W. Norton & Company
In Now, Muller addresses weaknesses in past theories about the flow of time and the meaning of “now.” He also presents his own revolutionary theory, one that makes testable predictions. He begins by describing the physics building blocks of his theory: relativity, entropy, entanglement, antimatter, and the Big Bang. Muller points out that the standard Big Bang theory explains the ongoing expansion of the universe as the continuous creation of new space. He argues that time is also expanding and that the leading edge of the new time is what we experience as “now.”
You’ll find a better explanation in the UC Berkeley short video, “Why does time advance?: Richard Muller’s new theory,” at the following link:
In the video, Muller explains that his theory would have resulted in a measurable 1 millisecond delay in “chirp” seen in the first gravitational wave signals detected on 11 February 2016 by the Laser Interferometer Gravitational-Wave Observatory (LIGO). LIGO’s current sensitivity precluded seeing the predicted small delay. If LIGO and other and-based gravity wave detector sensitivities are not adequate, a potentially more sensitive space-based gravity wave detection array, eLISA, should be in place in the 2020s to test Muller’s theory.
It’ll be interesting to see if LIGO, any of the other land-based gravity wave detectors, or eLISA will have the needed sensitivity to prove or disprove Muller’s theory.
For more information related to gravity wave detection, see my following posts:
16 December 2015 post, “100th Anniversary of Einstein’s General Theory of Relativity and the Advent of a New Generation of Gravity Wave Detectors ”
11 February 2016 post, “NSF and LIGO Team Announce First Detection of Gravitational Waves”
27 September 2016, “Space-based Gravity Wave Detection System to be Deployed by ESA”
The concepts of up and down appear to be relatively local conventions that can be applied at the levels of subatomic particles, planets and galaxies. However, the universe as a whole apparently does not have a preferred direction that would allow the concepts of up and down to be applied at such a grand scale.
A 7 September 2016 article entitled, “It’s official: You’re lost in a directionless universe,” by Adrian Cho, provides an overview of research that demonstrates, with a high level of confidence, that the universe is isotropic. The research was based on data from the Planck space observatory. In this article, Cho notes:
“Now, one team of cosmologists has used the oldest radiation there is, the afterglow of the big bang, or the cosmic microwave background (CMB), to show that the universe is “isotropic,” or the same no matter which way you look: There is no spin axis or any other special direction in space. In fact, they estimate that there is only a one-in-121,000 chance of a preferred direction—the best evidence yet for an isotropic universe. That finding should provide some comfort for cosmologists, whose standard model of the evolution of the universe rests on an assumption of such uniformity.”
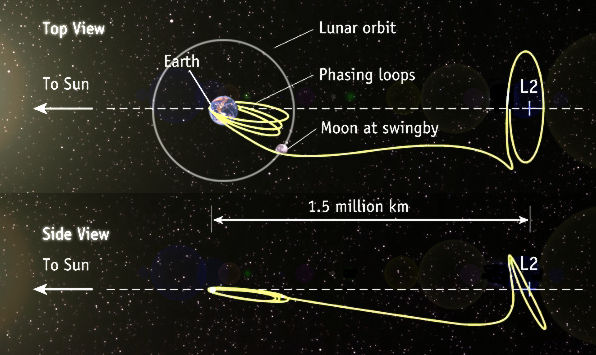
The European Space Agency (ESA) developed the Planck space observatory to map the CMB in microwave and infrared frequencies at unprecedented levels of detail. Planck was launched on 14 May 2009 and was placed in a Lissajous orbit around the L2 Lagrange point, which is 1,500,000 km (930,000 miles) directly behind the Earth. L2 is a quiet place, with the Earth shielding Planck from noise from the Sun. The approximate geometry of the Earth-Moon-Sun system and a representative spacecraft trajectory (not Planck, specifically) to the L2 Lagrange point is shown in the following figure.
Source: Abestrobi / Wikimedia Commons
The Planck space observatory entered service on 3 July 2009. At the end of its service life, Planck departed its valuable position at L2, was placed in a heliocentric orbit, and was deactivated on 23 October 2013. During more than four years in service, Planck performed its CBM mapping mission with much greater resolution than NASA’s Wilkinson Microwave Anisotropy Probe (WMAP), which operated from 2001 to 2010. Planck was designed to map the CMB with an angular resolution of 5-10 arc minutes and a sensitivity of a millionth of a degree.
One key result of the Planck mission is the all-sky survey shown below.
Planck all-sky survey 2013 CBM temperature map shows anisotropies in the temperature of the CMB at the full resolution obtained by Planck. Source: ESA / Planck Collaboration
ESA characterizes this map as follows:
“The CMB is a snapshot of the oldest light in our Universe, imprinted on the sky when the Universe was just 380,000 years old. It shows tiny temperature fluctuations that correspond to regions of slightly different densities, representing the seeds of all future structure: the stars and galaxies of today.”
The researchers who reported that the universe was isotropic noted that an anisotropic universe would leave telltale patterns in the CMB. However, these researchers found that the actual CMB shows only random noise and no signs of such patterns.
The researchers who reported that the universe was isotropic noted that an anisotropic universe would leave telltale patterns in the CMB. However, these researchers found that the actual CMB shows only random noise and no signs of such patterns.
In 2015, the ESA / Planck Collaboration used CMB data to estimate the age of the universe at 13.813 ± 0.038 billion years. This was lightly higher than, but within the uncertainty band of, an estimate derived in 2012 from nine years of data from NASA’s Wilkinson Microwave Anisotropy Probe (WMAP) spacecraft.
In July 2018, the ESA / Planck Collaboration published the “Planck Legacy” release of their results, which included the following two additional CBM sky survey maps.
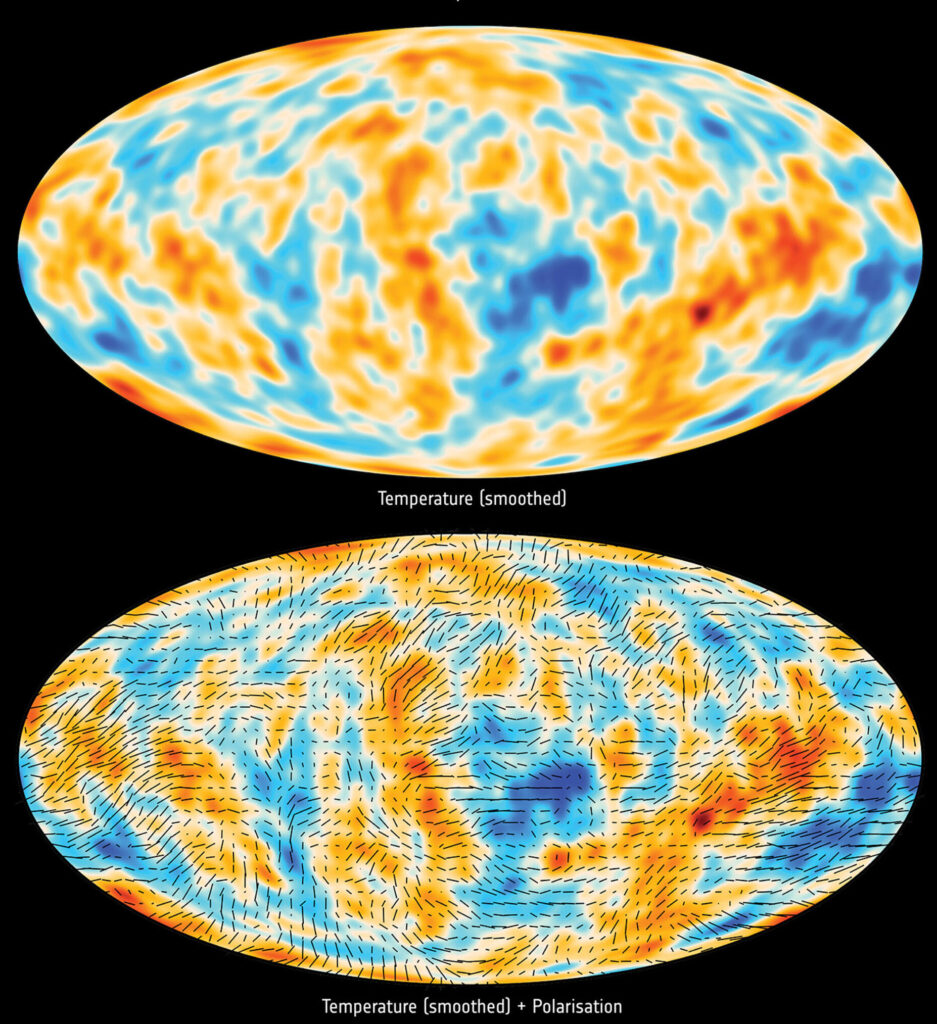
Planck all-sky survey 2013 CBM smoothed temperature map (top) and smoothed temperature + polarization map (bottom). Source: ESA / Planck Collaboration
The ESA/Planck Collaboration described these two new maps as follows:
(In the top map), “the temperature anisotropies have been filtered to show mostly the signal detected on scales around 5º on the sky. The lower view shows the filtered temperature anisotropies with an added indication of the direction of the polarized fraction of the CMB.”
“A small fraction of the CMB is polarized – it vibrates in a preferred direction. This is a result of the last encounter of this light with electrons, just before starting its cosmic journey. For this reason, the polarization of the CMB retains information about the distribution of matter in the early Universe, and its pattern on the sky follows that of the tiny fluctuations observed in the temperature of the CMB” (in the 2013 map, above).
Using Planck CMB data, the ESA / Planck Collaboration team has estimated the value of the Hubble constant. Their latest estimate, in 2018, was 67.4 km / second / megaparsec with an uncertainty of less than 1%. This is lower than the value derived from astrophysical measurements: 73.5 km / second / megaparsec with an uncertainty of 2%.
 Planck all-sky survey 2013 CBM temperature map shows anisotropies in the temperature of the CMB at the full resolution obtained by Planck. Source: ESA / Planck Collaboration