Category Archives: Power Generating Technology – Nuclear

The Importance of Baseload Generation and Real-Time Control to Grid Stability and Reliability

Peter Lobner

On 23 August 2017, the Department of Energy (DOE) issued a report entitled, “Staff Report to the Secretary on Energy Markets and Reliability.” In his cover letter, Energy Secretary Rick Perry notes:

“It is apparent that in today’s competitive markets certain regulations and subsidies are having a large impact on the functioning of markets, and thereby challenging our power generation mix. It is important for policy makers to consider their intended and unintended effects.”

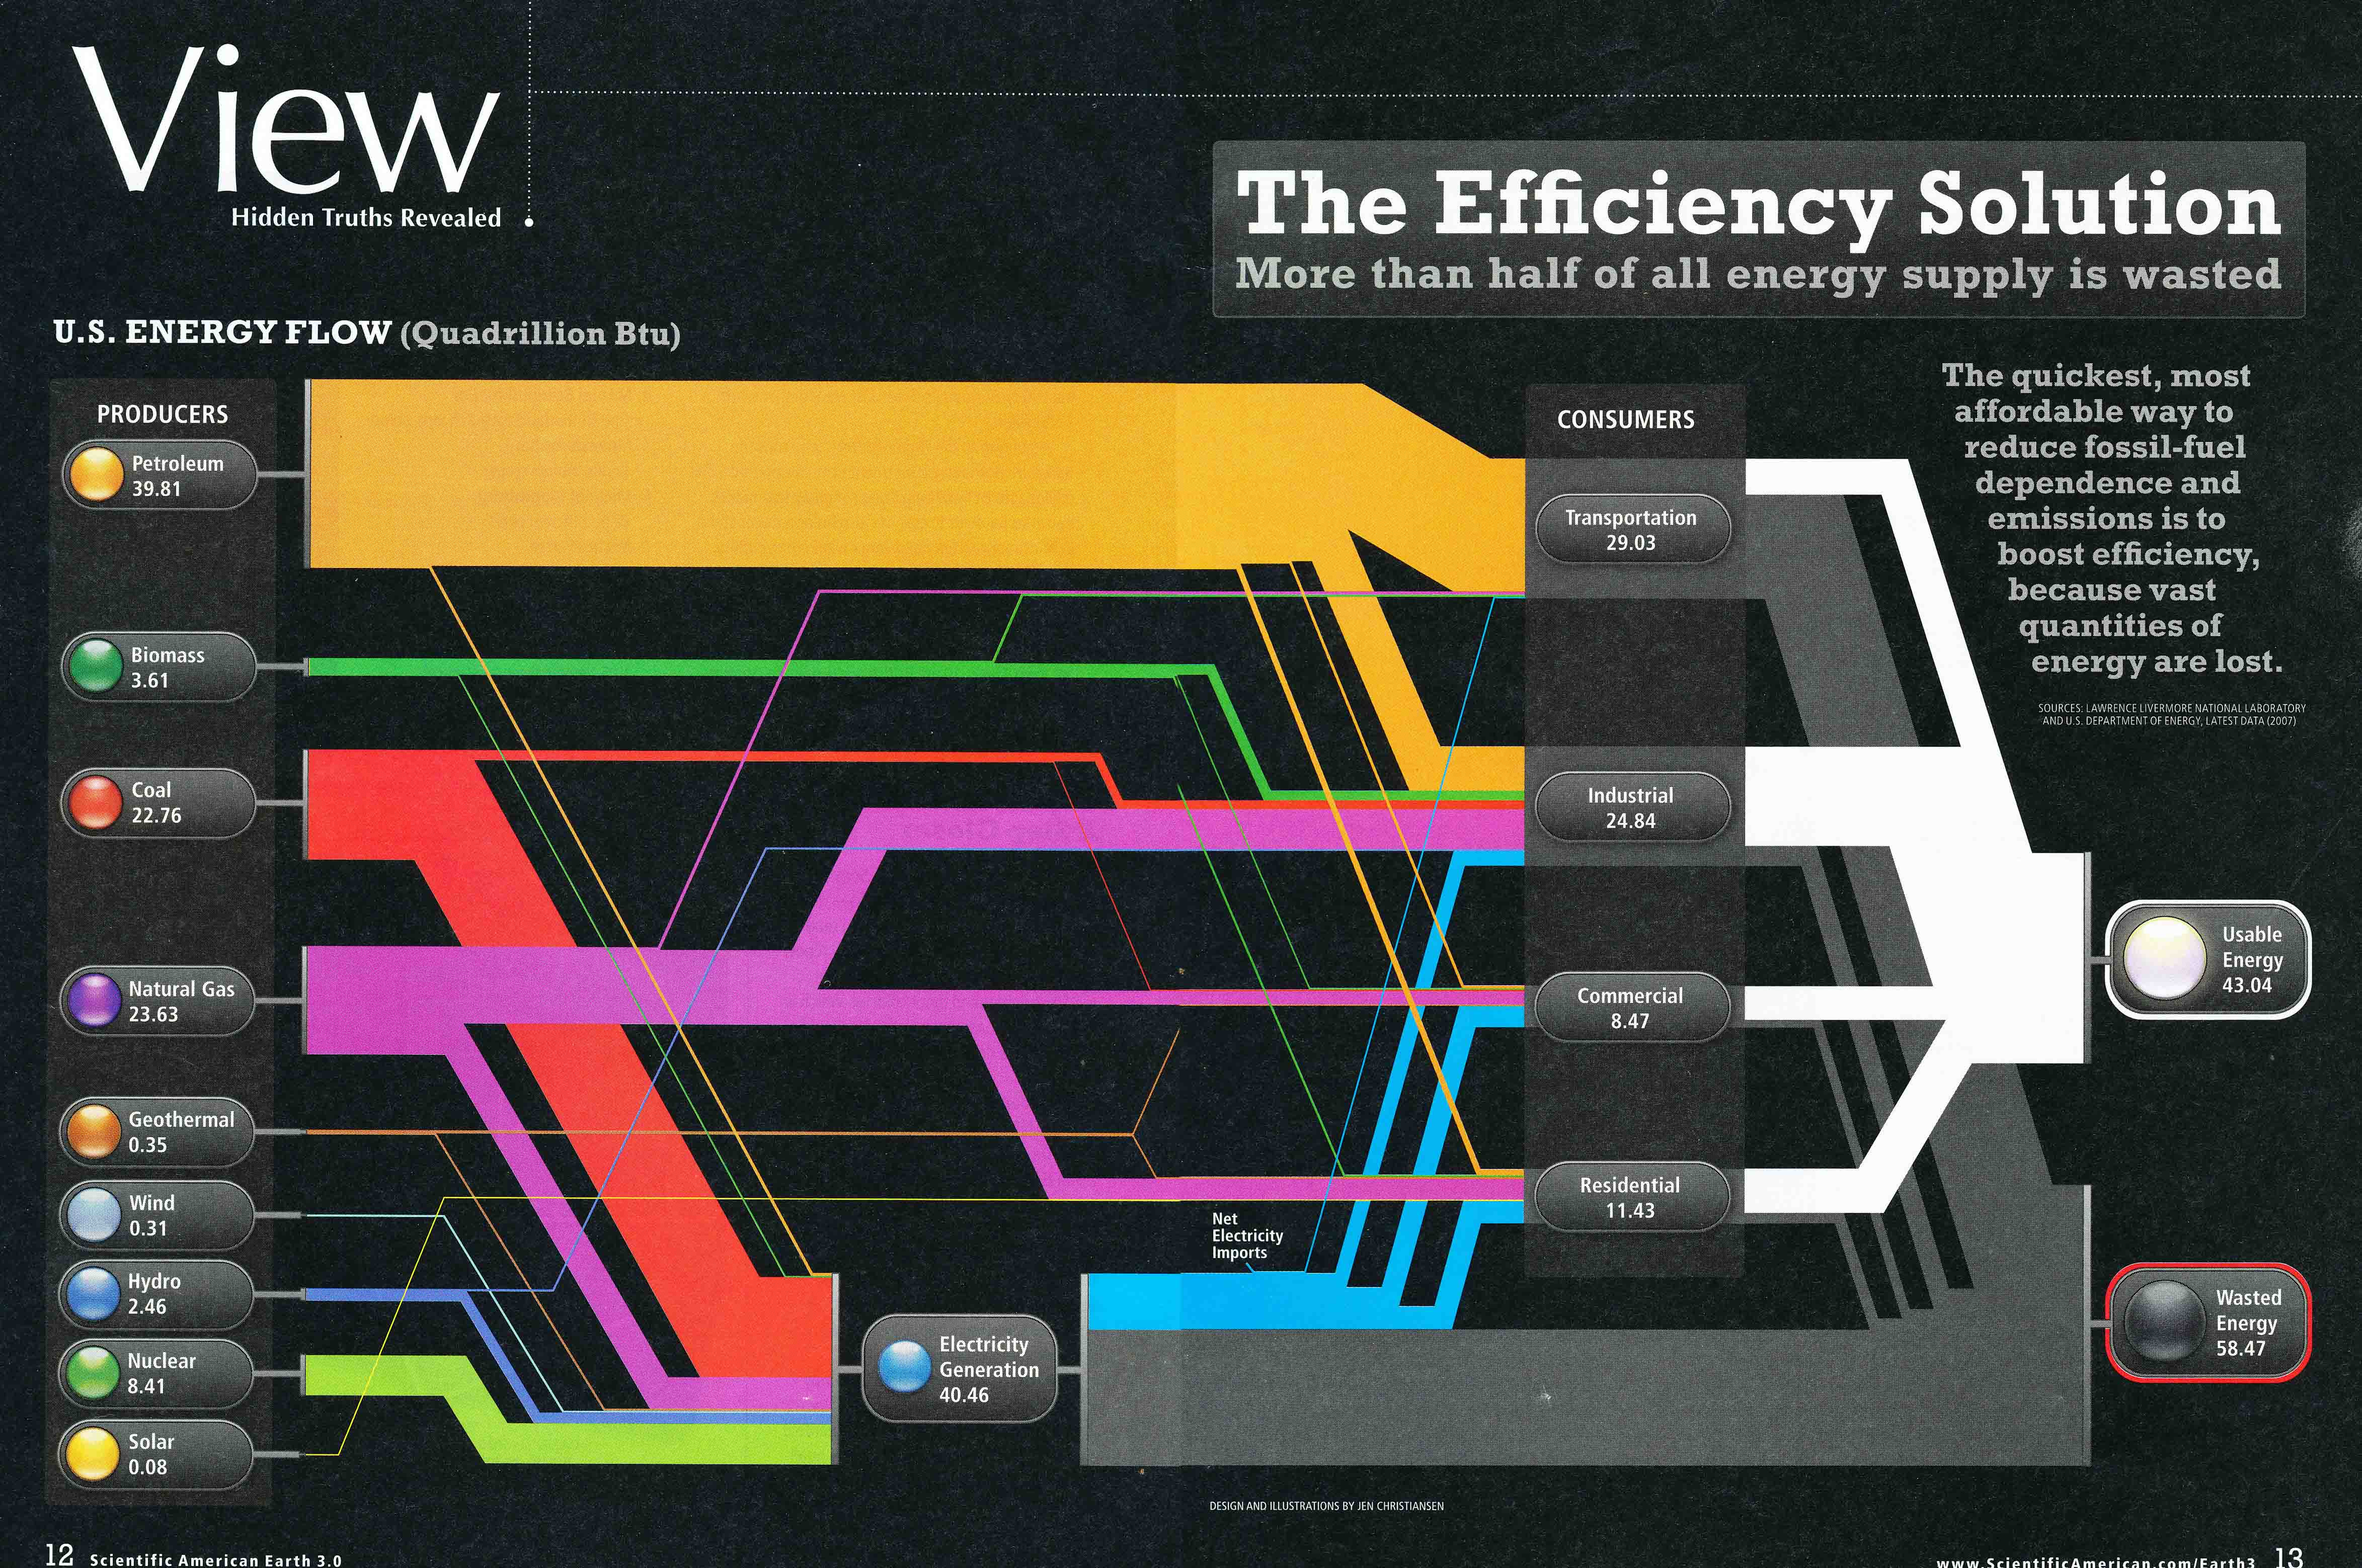
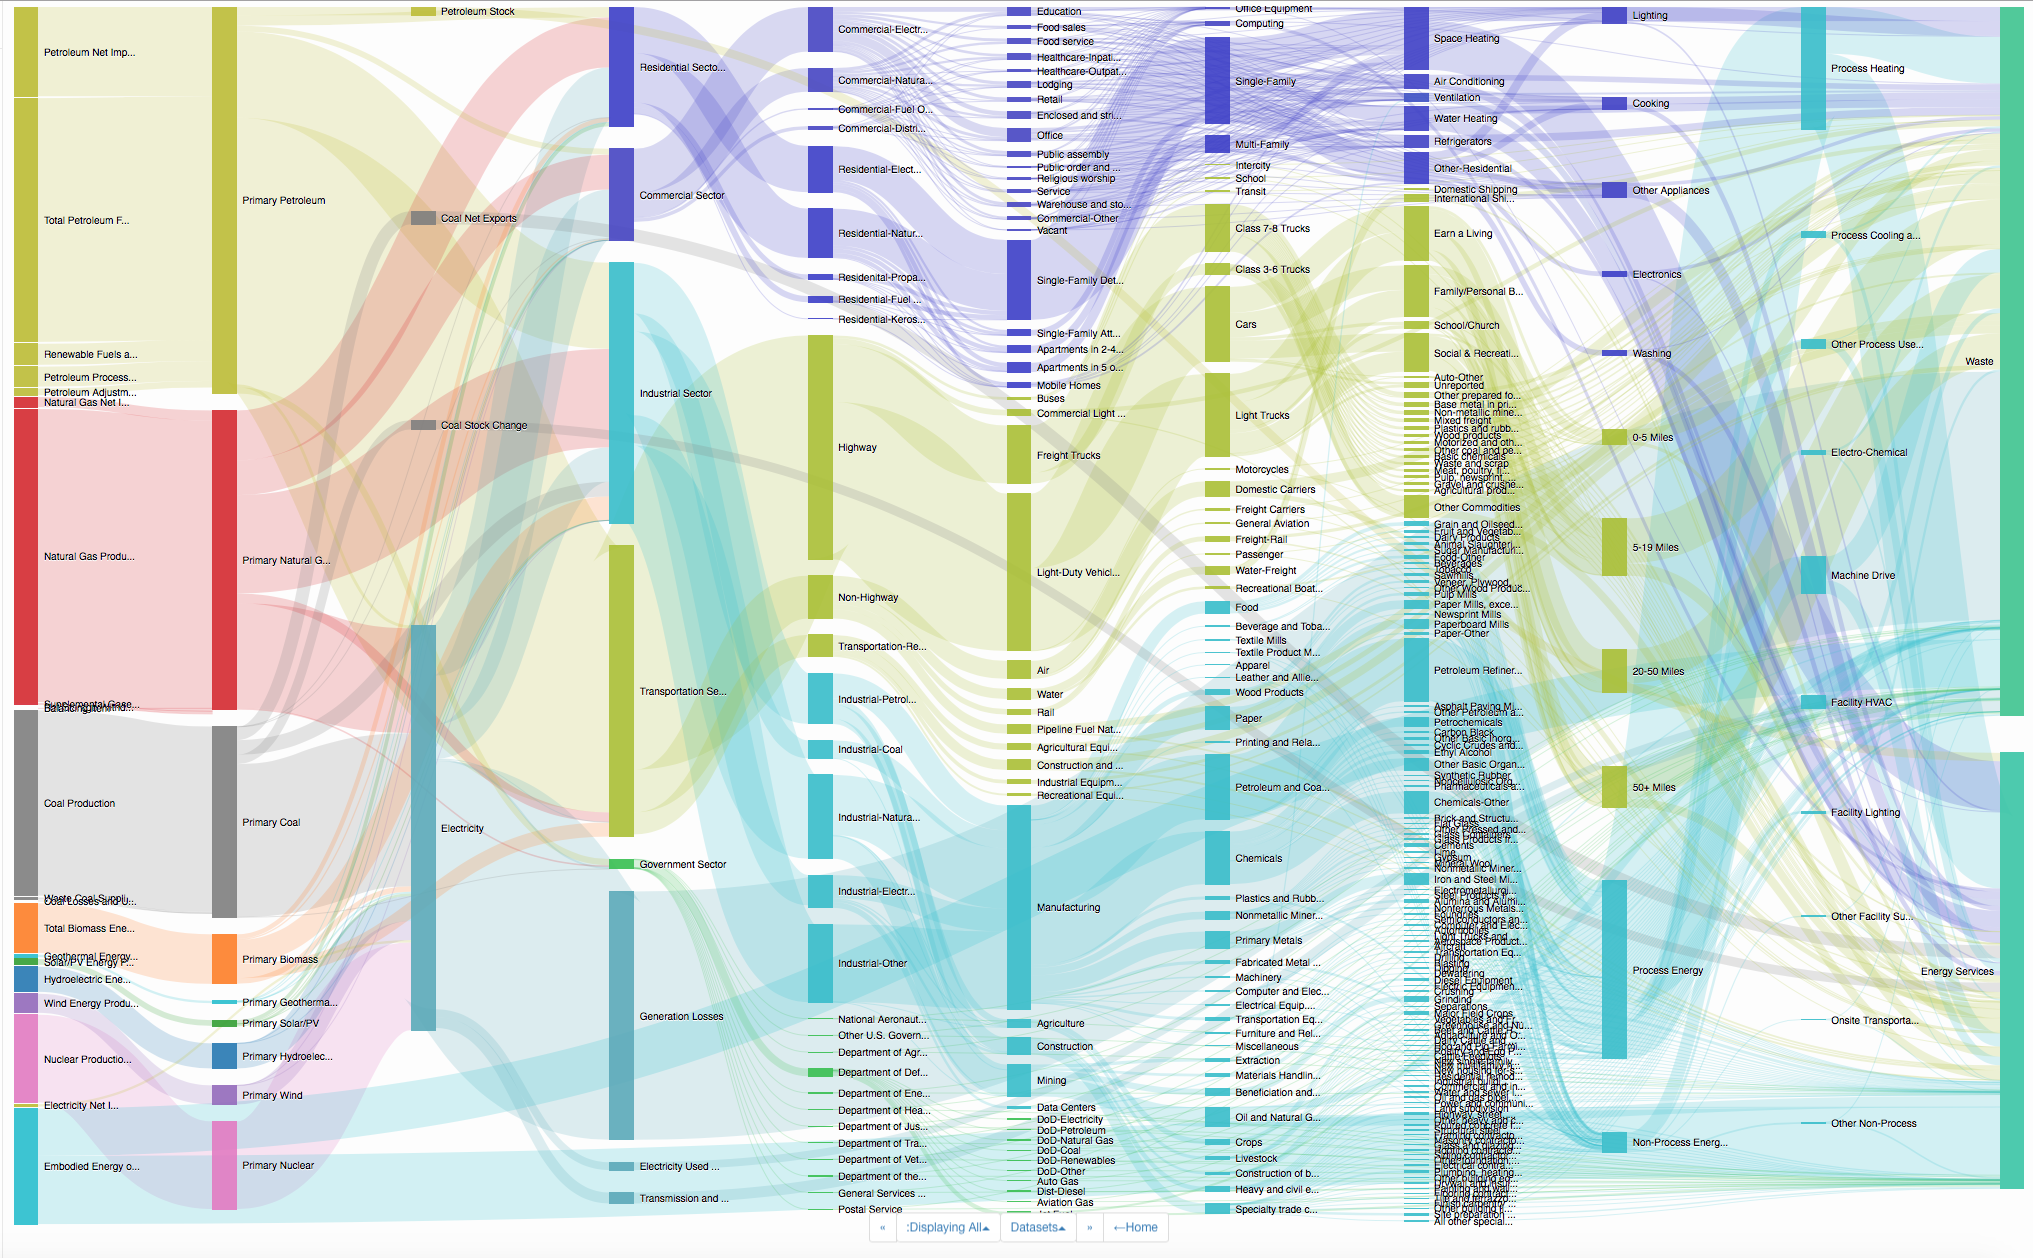
Among the consequences of the national push to implement new generation capacity from variable renewable energy (VRE) resources (i.e., wind & solar) are: (1) increasing grid perturbations due to the variability of the output from VRE generators, and (2) early retirement of many baseload generating plants because of several factors, including the desire of many states to meet their energy demand with a generating portfolio containing a greater percentage of VRE generators. Grid perturbations can challenge the reliability of the U.S. bulk power systems that comprise our national electrical grid. The reduction of baseload capacity reduces the resilience of the bulk power system and its ability dampen these perturbations.

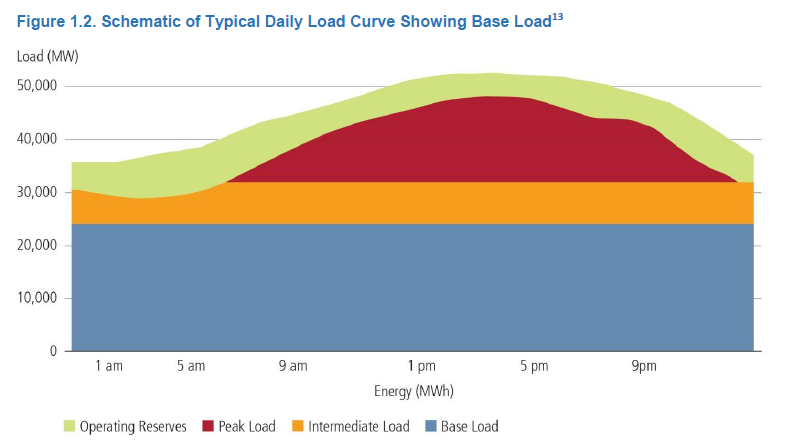
The DOE staff report contains the following typical daily load curve. Baseload plants include nuclear and coal that operate at high capacity factor and generally do not maneuver in response to a change in demand. The intermediate load is supplied by a mix of generators, including VRE generators, which typically operate at relatively low capacity factors. The peak load generators typically are natural gas power plants that can maneuver or be cycled (i.e., on / off) as needed to meet short-term load demand. The operating reserve is delivered by a combination of power plants that can be reliably dispatched if needed.

The trends in new generation additions and old generation retirements is summarized in the following graphic from the DOE staff report.

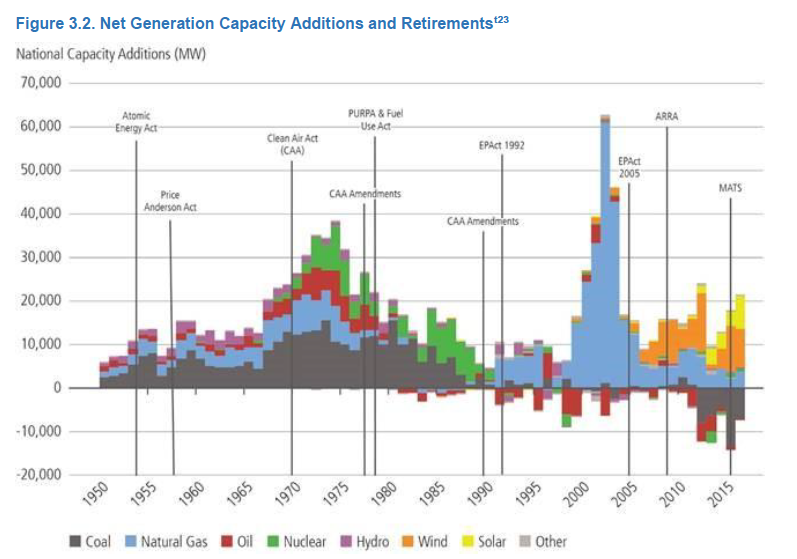
Here you can see that recent additions (since 2006) have focused on VRE generators (wind and solar) plus some new natural gas generators. In that same period, retirements have focused on oil, coal and nuclear generators, which likely were baseload generators.

The DOE staff report noted that continued closure of baseload plants puts areas of the country at greater risk of power outages. It offered a list of policy recommendations to reverse the trend, including providing power pricing advantages for baseload plants to continue operating, and speeding up and reducing costs for permitting for baseload power and transmission projects.

Regarding energy storage, the DOE staff report states the following in Section 4.1.3:

“Energy storage will be critical in the future if higher levels of VRE are deployed on the grid and require additional balancing of energy supply and demand in real time.”

“DOE has been investing in energy storage technology development for two decades, and major private investment is now active in commercializing and the beginnings of early deployment of grid-level storage, including within microgrids.”

Options for energy storage are identified in the DOE staff report.

You can download the DOE staff report to the Secretary and Secretary Perry’s cover letter here:

https://energy.gov/downloads/download-staff-report-secretary-electricity-markets-and-reliability

Lyncean members should recall our 2 August 2017 meeting and the presentation by Patrick Lee entitled, “A fast, flexible & coordinated control technology for the electric grid of the future.” This presentation described work by Sempra Energy and its subsidiary company PXiSE Energy Solutions to address the challenges to grid stability caused by VRE generators.   An effective solution has been demonstrated by adding energy storage and managing the combined output of the VER generators and the energy storage devices in real-time to match supply and demand and help stabilize the grid. This integrated solution, with energy storage plus real-time automated controls, appears to be broadly applicable to VRE generators and offers the promise, especially in Hawaii and California, for resilient and reliable electrical grids even with a high percentage of VRE generators in the state’s generation portfolio.

You can download Patrick Lee’s 2 August 2017 presentation to the Lyncean Group of San Diego at the following link:

https://lynceans.org/talk-113-8217/

Energy Literacy

Peter Lobner

I was impressed in 2007 by the following chart in Scientific American, which shows where our energy in the U.S. comes from and how the energy is used in electricity generation and in four consumer sectors. One conclusion is that more than half of our energy is wasted, which is clearly shown in the bottom right corner of the chart. However, this result shouldn’t be surprising.

2007 USA energy utilizationSource: Scientific American / Jen Christiansen, using LLNL & DOE 2007 data

The waste energy primarily arises from the efficiencies of the various energy conversion cycles being used. For example, the following 2003 chart shows the relative generating efficiencies of a wide range of electric power sources. You can see in the chart that there is a big plateau at 40% efficiency for many types of thermal cycle power plants. That means that 60% of the energy they used is lost as waste heat. The latest combined cycle plants have demonstrated net efficiencies as high as 62.22% (Bouchain, France, 2016, see details in my updated 17 March 2015 post, “Efficiency in Electricity Generation”).

Comparative generation  efficiencies-Eurelectric 2003Source: Eurelectric and VGB PowerTech, July 2003

Another source of waste is line loss in electricity transmission and distribution from generators to the end-users. The U.S. Energy Information Administration (EIA) estimates that electricity transmission and distribution losses average about 6% of the electricity that is transmitted and distributed.

There is an expanded, interactive, zoomable map of U.S. energy data that goes far beyond the 2007 Scientific American chart shown above. You can access this interactive map at the following link:

http://energyliteracy.com

The interactivity in the map is impressive, and the way it’s implemented encourages exploration of the data in the map. You can drill down on individual features and you can explore particular paths in much greater detail than you could in a physical chart containing the same information. Below are two example screenshots. The first screenshot is a top-level view. As in the Scientific American chart, energy sources are on the left and final disposition as energy services or waste energy is on the right. Note that waste energy is on the top right of the interactive map.

Energy literacy map 1

The second screenshot is a more detailed view of natural gas production and utilization.

Energy literacy map 2

As reported by Lulu Chang on the digitaltrends.com website, this interactive map was created by Saul Griffith at the firm Otherlab (https://otherlab.com). You can read her post at the following link:

http://www.digitaltrends.com/home/otherlab-energy-chart/

I hope you enjoy exploring the interactive energy literacy map.

Quadrennial Energy Review

Peter Lobner

On 9 January 2014 the Administration launched a “Quadrennial Energy Review” (QER) to examine “how to modernize the Nation’s energy infrastructure to promote economic competitiveness, energy security, and environmental responsibility…” You can read the Presidential Memorandum establishing the QER at the following link:

https://www.whitehouse.gov/the-press-office/2014/01/09/presidential-memorandum-establishing-quadrennial-energy-review

You can get a good overview of the goals of the QER in a brief factsheet at the following link:

https://www.whitehouse.gov/the-press-office/2015/04/21/fact-sheet-administration-announces-new-agenda-modernize-energy-infrastr

On April 21, 2015, the QER Task Force released the “first installment” of the QER report entitled “Energy Transmission, Storage, and Distribution Infrastructure.” The Task Force announcement stated:

“The first installment (QER 1.1) examines how to modernize our Nation’s energy infrastructure to promote economic competitiveness, energy security, and environmental responsibility, and is focused on energy transmission, storage, and distribution (TS&D), the networks of pipelines, wires, storage, waterways, railroads, and other facilities that form the backbone of our energy system.”

The complete QER 1.1 report or individual chapters are available at the following link:

https://energy.gov/epsa/quadrennial-energy-review-first-installment

QER 1.1 contents are listed below:

QER 1.1 contentOn January 6, 2017, the QER Task Force released the “second installment” of the QER report entitled “Transforming the Nation’s Electricity System.” The Task Force announcement stated:

“The second installment (QER 1.2) finds the electricity system is a critical and essential national asset, and it is a strategic imperative to protect and enhance the value of the electricity system through modernization and transformation. QER 1.2 analyzes trends and issues confronting the Nation’s electricity sector out to 2040, examining the entire electricity system from generation to end use, and within the context of three overarching national goals: (1) enhance economic competitiveness; (2) promote environmental responsibility; and (3) provide for the Nation’s security.

The report provides 76 recommendations that seek to enable the modernization and transformation of the electricity system. Undertaken in conjunction with state and local governments, policymakers, industry, and other stakeholders, the recommendations provide the building blocks for longer-term, planned changes and activities.”

The complete QER 1.2 report or individual chapters are available at the following link:

https://energy.gov/epsa/quadrennial-energy-review-second-installment

QER 1.2 contents are listed below:

QER 1.2 contentI hope you take time to explore the QERs. I think the Task Force has collected a great deal of actionable information in the two reports. Converting this information into concrete actions will be a matter for the next Administration.

NuScale Submits First Ever Design Certification Application (DCA) for a Small Modular Reactor (SMR)

Peter Lobner

For all the talk about SMRs over the past two decades or more, there have been no SMR license applications submitted to the U.S. Nuclear Regulatory Commission (NRC) until now. On 31 December 2016, NuScale Power, Portland, OR made the first ever request to the NRC to initiate a licensing review of an SMR. On 12 January 2017, NuScale made the formal submittal to NRC of all the required DCA documents for an SMR power plant comprised of 12 individual NuScale Power ModulesTM.

An NPM is a small pressurized water reactor (PWR) with an integrated primary system and many passive features for normal modes of operation and for safe shutdown in response to abnormal or accident conditions. NuScale claims that the passive safety features enable shutdown and self-cooling with no operator action, no AC or DC power, and no external water.

You’ll find a good 2013 overview of the NuScale Power ModuleTM on the IAEA’s (International Atomic Energy Agency’s) ARIS (Advanced Reactor Information System) website at the following link:

https://aris.iaea.org/sites/..%5CPDF%5CNuScale.pdf

More information is available on the NuScale Power website at the following link:

http://www.nuscalepower.com

The basic, factory-manufactured NPM is rated at 160 MWt, which could deliver about 45 MWe. A power plant with 12 NPMs would have a combined output of 1,920 MWt and about 540 MWe. A single NPM is shown below.

NuScale moduleSource: NuScale Power

NuScale Power anticipates a 42-month licensing process as outlined in the following chart. If this schedule can be achieved, then the NRC could issue a Design Certification (DC) as soon as July 2020. At that time, the standard design of a modular NuScale power plant with up to 12 NPMs will have NRC approval independent of an application to construct or operate a specific plant. A design certification is valid for 15 years from the date of issuance and can be renewed.

NuScale licensing scheduleSource: NuScale Power

A license application for an actual plant will focus on site-specific issues and should not need to re-open issues already covered in the NRC’s DC review. This greatly de-risks construction of a new nuclear power plant based on the NPM standard design approved in the DC. NuScale forecasts that the first NPM could go into operation as soon as 2024.

New Safe Confinement Structure Moved into Place at Chernobyl Unit 4

Peter Lobner

Following the Chernobyl accident on 26 April 1986, a concrete and steel “sarcophagus” was built around the severely damaged Unit 4 as an emergency measure to halt the release of radioactive material into the atmosphere from that unit. For details on the design and construction of the sarcophagus, including many photos of the damage at Unit 4, visit the chernobylgallery.com website at the following link:

http://chernobylgallery.com/chernobyl-disaster/sarcophagus/

The completed sarcophagus is shown below, at left end of the 4-unit Chernobyl nuclear plant. In 1988, Soviet scientists announced that the sarcophagus would only last 20–30 years before requiring restorative maintenance work. They were a bit optimistic.

Sarcophagus overview photoThe completed sarcophagus at left end of the 4-unit Chernobyl nuclear plant. Source: chernobylgallery.com

Sarcophagus closeup photoClose-up of the sarcophagus. Source: chernobylgallery.com

Inside-sarcophagusCross-section of the sarcophagus. Source: chernobylgallery.com

The sarcophagus rapidly deteriorated. In 2006, the “Designed Stabilization Steel Structure” was extended to better support a damaged roof that posed a significant risk if it collapsed. In 2010, it was found that water leaking through the sarcophagus roof was becoming radioactively contaminated as it seeped through the rubble of the damaged reactor plant and into the soil.

To provide a longer-term remedy for Chernobyl Unit 4, the  European Bank of Reconstruction and Development (EBRD) funded the design and construction of the New Safe Confinement (NSC, or New Shelter) at a cost of about €1.5 billion ($1.61 billion) for the shelter itself. Total project cost is expected to be about €2.1 billion ($2.25 billion).

Construction by Novarka (a French construction consortium of VINCI Construction and Bouygues Construction) started in 2012. The arched NSC structure was built in two halves and joined together in 2015. The completed NSC is the largest moveable land-based structure ever built, with a span of 257 m (843 feet), a length of 162 m (531 feet), a height of 108 m (354 feet), and a total weight of 36,000 tonnes.

NSC exterior viewNSC exterior view. Source: EBRD

NSC cross section

NSC cross-section. Adapted from phys.org/news

Novarka started moving the NSC arch structure into place on 14 November 2016 and completed the task more than a week later. The arched structure was moved into place using a system of 224 hydraulic jacks that pushed the arch 60 centimeters (2 feet) each stroke. On 29 November 2016, a ceremony at the site was attended by Ukrainian president, Petro Poroshenko, diplomats and site workers, to celebrate the successful final positioning of the NSC over Chernobyl Unit 4.

EBRD reported on this milestone:

“Thirty years after the nuclear disaster in Chernobyl, the radioactive remains of the power plant’s destroyed reactor 4 have been safely enclosed following one of the world’s most ambitious engineering projects.

Chernobyl’s giant New Safe Confinement (NSC) was moved over a distance of 327 meters (1,072 feet) from its assembly point to its final resting place, completely enclosing a previous makeshift shelter that was hastily assembled immediately after the 1986 accident.

The equipment in the New Safe Confinement will now be connected to the new technological building, which will serve as a control room for future operations inside the arch. The New Safe Confinement will be sealed off from the environment hermetically. Finally, after intensive testing of all equipment and commissioning, handover of the New Safe Confinement to the Chernobyl Nuclear Power Plant administration is expected in November 2017.”

You can see EBRD’s short video of this milestone, “Unique engineering feat concluded as Chernobyl arch reaches resting place,” at the following link

https://www.youtube.com/watch?v=dH1bv9fAxiY

The NSC has an expected lifespan of at least 100 years.

The NSC is fitted with an overhead crane to allow for the future dismantling of the existing sarcophagus and the remains of Chernobyl Unit 4.

International Energy Agency (IEA) Assesses World Energy Trends

Peter Lobner

The IEA issued two important reports in late 2016, brief overviews of which are provided below.

World Energy Investment 2016 (WEI-2016)

In September 2016, the IEA issued their report, “World Energy Investment 2016,” which, they state, is intended to addresses the following key questions:

  • What was the level of investment in the global energy system in 2015? Which countries attracted the most capital?
  • What fuels and technologies received the most investment and which saw the biggest changes?
  • How is the low fuel price environment affecting spending in upstream oil and gas, renewables and energy efficiency? What does this mean for energy security?
  • Are current investment trends consistent with the transition to a low-carbon energy system?
  • How are technological progress, new business models and key policy drivers such as the Paris Climate Agreement reshaping investment?

The following IEA graphic summarizes key findings in WEI-2016 (click on the graphic to enlarge):

WEI-2016

You can download the Executive Summary of WEI-2016 at the following link:

https://www.iea.org/newsroom/news/2016/september/world-energy-investment-2016.html

At this link, you also can order an individual copy of the complete report for a price (between €80 – €120).

You also can download a slide presentation on WEI 2016 at the following link:

https://csis-prod.s3.amazonaws.com/s3fs-public/event/161025_Laszlo_Varro_Investment_Slides_0.pdf

World Energy Outlook 2016 (WEO-2016)

The IEA issued their report, “World Energy Outlook 2016,” in November 2016. The report addresses the expected transformation of the global energy mix through 2040 as nations attempt to meet national commitments made in the Paris Agreement on climate change, which entered into force on 4 November 2016.

You can download the Executive Summary of WEO-2016 at the following link:

https://www.iea.org/newsroom/news/2016/november/world-energy-outlook-2016.html

At this link, you also can order an individual copy of the complete report for a price (between €120 – €180).

The following IEA graphic summarizes key findings in WEO-2016 (click on the graphic to enlarge):

WEO-2016

Climate Change and Nuclear Power

Peter Lobner

In September 2016, the International Atomic Energy Agency (IAEA) published a report entitled, “Climate Change and Nuclear Power 2016.” As described by the IAEA:

“This publication provides a comprehensive review of the potential role of nuclear power in mitigating global climate change and its contribution to other economic, environmental and social sustainability challenges.”

An important result documented in this report is a comparative analysis of the life cycle greenhouse gas (GHG) emissions for 10 electric power generating technologies. The IAEA authors note that:

“By comparing the GHG emissions of all existing and future energy technologies, this section (of the report) demonstrates that nuclear power provides energy services with very few GHG emissions and is justifiably considered a low carbon technology.

In order to make an adequate comparison, it is crucial to estimate and aggregate GHG emissions from all phases of the life cycle of each energy technology. Properly implemented life cycle assessments include upstream processes (extraction of construction materials, processing, manufacturing and power plant construction), operational processes (power plant operation and maintenance, fuel extraction, processing and transportation, and waste management), and downstream processes (dismantling structures, recycling reusable materials and waste disposal).”

The results of this comparative life cycle GHG analysis appear in Figure 5 of this report, which is reproduced below (click on the graphic to enlarge):

IAEA Climate Change & Nuclear Power

You can see that nuclear power has lower life cycle GHG emissions that all other generating technologies except hydro. It also is interesting to note how effective carbon dioxide capture and storage could be in reducing GHG emissions from fossil power plants.

You can download a pdf copy of this report for free on the IAEA website at the following link:

http://www-pub.iaea.org/books/iaeabooks/11090/Climate-Change-and-Nuclear-Power-2016

For a link to a similar 2015 report by The Brattle Group, see my post dated 8 July 2015, “New Report Quantifies the Value of Nuclear Power Plants to the U.S. Economy and Their Contribution to Limiting Greenhouse Gas (GHG) Emissions.”

It is noteworthy that the U.S. Environmental Protection Agency’s (EPA) Clean Power Plan (CPP), which was issued in 2015, fails to give appropriate credit to nuclear power as a clean power source. For more information on this matter see my post dated 2 July 2015,” EPA Clean Power Plan Proposed Rule Does Not Adequately Recognize the Role of Nuclear Power in Greenhouse Gas Reduction.”

In contrast to the EPA’s CPP, New York state has implemented a rational Clean Energy Standard (CES) that awards zero-emissions credits (ZEC) that favor all technologies that can meet specified emission standards. These credits are instrumental in restoring merchant nuclear power plants in New York to profitable operation and thereby minimizing the likelihood that the operating utilities will retire these nuclear plants early for financial reasons. For more on this subject, see my post dated 28 July 2016, “The Nuclear Renaissance is Over in the U.S.”  In that post, I noted that significant growth in the use of nuclear power will occur in Asia, with use in North America and Europe steady or declining as older nuclear power plants retire and fewer new nuclear plants are built to take their place.

An updated projection of worldwide use of nuclear power is available in the 2016 edition of the IAEA report, “Energy, Electricity and Nuclear Power Estimates for the Period up to 2050.” You can download a pdf copy of this report for free on the IAEA website at the following link:

http://www-pub.iaea.org/books/IAEABooks/11120/Energy-Electricity-and-Nuclear-Power-Estimates-for-the-Period-up-to-2050

Combining the information in the two IAEA reports described above, you can get a sense for what parts of the world will be making greater use of nuclear power as part of their strategies for reducing GHG emissions. It won’t be North America or Europe.

Current Status of the Fukushima Daiichi Nuclear Power Station (NPS)

Peter Lobner

Following a severe offshore earthquake on 11 March 2011 and subsequent massive tidal waves, the Fukushima Daiichi NPS and surrounding towns were severely damaged by these natural events. The extent of damage to the NPS, primarily from the effects of flooding by the tidal waves, resulted in severe fuel damage in the operating Units 1, 2 and 3, and hydrogen explosions in Units 1, 3 and 4. In response to the release of radioactive material from the NPS, the Japanese government ordered the local population to evacuate. You’ll find more details on the Fukushima Daiichi reactor accidents in my 18 January 2012 Lyncean presentation (Talk #69), which you can access at the following link:

https://lynceans.org/talk-69-11812/

On 1 September 2016, Tokyo Electric Power Company Holdings, Inc. (TEPCO) issued a video update describing the current status of recovery and decommissioning efforts at the Fukushima Daiichi NPS, including several side-by-side views contrasting the immediate post-accident condition of a particular unit with its current condition. Following is one example showing Unit 3.

Fukushima Unit 3_TEPCO 1Sep16 video updateSource: TEPCO

You can watch this TEPCO video at the following link:

http://www.tepco.co.jp/en/news/library/archive-e.html?video_uuid=kc867112&catid=69631

This video is part of the TEPCO Photos and Videos Library, which includes several earlier videos on the Fukushima Daiichi NPS as well as videos on other nuclear plants owned and operated by TEPCO (Kashiwazaki-Kariwa and Fukushima Daini) and other TEPCO activities. TEPCO estimates that recovery and decommissioning activities at the Fukushima Daiichi NPS will continue for 30 – 40 years.

An excellent summary article by Will Davis, entitled, “TEPCO Updates on Fukushima Daiichi Conditions (with video),” was posted on 30 September 2016 on the ANS Nuclear Café website at the following link:

http://ansnuclearcafe.org/2016/09/30/tepco-updates-on-fukushima-daiichi-conditions-with-video/

For additional resources related to the Fukushima Daiichi accident, recovery efforts, and lessons learned, see my following posts on Pete’s Lynx:

  • 20 May 2016: Fukushima Daiichi Current Status and Lessons Learned
  • 22 May 2015: Reflections on the Fukushima Daiichi Nuclear Accident
  • 8 March 2015: Scientists Will Soon Use Natural Cosmic Radiation to Peer Inside Fukushima’s Mangled Reactor

China is Developing Floating Nuclear Power Plants

Peter Lobner

Various reports in 2016 indicate that China has designed and is constructing its first indigenous floating nuclear power plant. This mobile power plant is intended for deployment to remote coastal locations and to islands being developed by China in the South China Sea. According to China General Nuclear Power Corporation (CGN), this floating nuclear power plant is intended to operate as a combined energy supply platform that is capable of delivering electric power, low-temperature process heat, and fresh water as needed by the particular application. Construction of the first unit started in 2015 and is scheduled to be completed in 2018 and operational by 2020. It also has been reported that China Shipbuilding Industry Corporation (CSIC) is building the first floating nuclear power plant, with plans to build a total of 20 for deployment in the South China Sea.

The availability of ample supplies of electric power, low-temperature process heat, and fresh water will enable more rapid development in remote regions, including construction of new infrastructure for harbors, airports, defense and commercial activities such as oil exploration and oil field exploitation and other marine resource development.

CGN reports that the nuclear steam supply system (NSSS) for the first floating nuclear power plant is a single “small modular offshore reactor” ACPR50S, which is a compact two-loop pressurized water reactor (PWR). China’s National Development and Reform Commission (NDRC) recently approved this reactor design as part of the 13th Five-Year Plan for innovative energy technologies. The ACPR50S is rated at 200 MWt, with an electrical output of 60 MWe.

In comparison, the first Russian floating nuclear power plant, Akademik Lomonosov, has 2 x KLT-40S modular PWRs that will provide 70 MWe net electrical output and low-temperature process heat for shore installations. Akademik Lomonosov is schedule for its initial core load at the Baltiisky Zavod shipyard in St. Petersburg, Russia in late 2016. After completing reactor testing, it is expected that Akademik Lomonosov will depart St. Petersburg in October 2017 and be towed along the north coast of Siberia to the Arctic port of Pevek, where it will be moored and connected to the grid.

The physical layout if the ACPR50S is shown below. The major components of the NSSS are the reactor vessel, two steam generators and primary pumps, and one pressurizer.

ACPR50S NSSSACPR50S NSSS. Source: CGN

The primary system is housed within a containment structure that is protected against damage from a ship collision (similar to design features in NS Savannah and other early commercial nuclear powered vessels). Active and passive safety systems provide for core and containment cooling during an accident. Severe (beyond design basis) accident mitigation measures include opening safety plugs to submerge the NSSS in seawater to ensure continued core cooling. The physical arrangement of the NSSS within the vessel is shown below.

ACPR50S shipboard arrangementAPR50S physical arrangement in the vessel. Source: CGN

The floating nuclear power plant is designed for on-ship refueling and pre-treatment of radioactive waste. When the floating nuclear power plant is deployed in a remote location, a visiting offshore engineering services vessel will provide logistics and maintenance services as needed.

The following figure shows how a floating nuclear power plant might look moored to a pier and delivering electric power, process heat and fresh water to a shore installation.

China Floating NPP moored at shore installationSource: CGN

The floating nuclear power plant also could be deployed to support one or many oil drilling platforms as shown below.

China Floating NPP at oil platformSource: CGN

A important issue related to China’s deployment of floating nuclear power plants is that they may be deployed to support military development of islands in contested areas of the South China Sea. Time will tell how this scenario plays out.

IAEA’s Nuclear Technology Review 2016

Peter Lobner

In June 2016, the International Atomic Energy Agency (IAEA) published a report by the Director General entitled, “Nuclear Technology Review 2016,” which highlights notable developments in 2015 in the following segments of the worldwide nuclear industry.

  • Power applications
    • Generation
    • Fuel cycle
    • Safety
  • Advanced fission
    • Gen III large water cooled reactors
    • Fast reactors
    • Gas-cooled reactors
    • Small & medium size reactors (SMRs)
    • Gen IV advanced reactors
  • Fusion
  • Accelerator and research reactor applications
  • Other applications
    • Emerging industrial applications of radiation technologies
    • Advances in medical imaging technology
    • Use of radiation in connection with managing mosquito disease vectors
    • Use of isotopic techniques for soil management

The following chart from the IAEA report shows the age distribution (years of operation) of the worldwide fleet of 441 operating power reactors. The median age of this fleet is about 26 years, and you can see a bow wave of aging nuclear power plants, followed by far fewer younger plants already in operation.

IAEA distribution of reactor age 2015

The following chart from the IAEA report shows the number of new plants under construction by region. As of the end of 2015, a total of 68 nuclear power plants were in various stages of their decade-long construction cycles. This chart clearly shows that Western Europe and the Americas are minor players in the construction of new reactors. Most of the new power reactor construction is occurring in Asia and Central / Eastern Europe.

IAEA reactors under construction 2015

IAEA reported that, in 2015, worldwide nuclear power generation reached 381.7 GWe. Projections for the future growth of nuclear power generation thru 2050 were given for two cases:

  • Low case: In this case, new plants just make up for the generating capacity lost from retiring plants. Projected 2050 worldwide generation: 371 GWe.
  • High case: This is a much more optimistic case, yielding about 964 GWe worldwide generation by 2050.

IAEA noted that, “The 21st Conference of the Parties to the United Nations Framework Convention on Climate Change (COP21) resulted in the Paris Agreement that neither identifies nor excludes any particular form of energy.” The Paris Agreement does not discriminate against nuclear power as a means for reaching lower carbon emission goals. In contrast, the U.S. Environmental Protection Agency’s (EPA) euphemistically named “Clean Power Plan” fails to give appropriate credit to nuclear power as a means for utilities and states to reduce the carbon emissions from their portfolio of power plants. (See my 3 July 2015 and 27 November 2015 posts for more on CPP).

IAEA further noted the contribution of nuclear power to meeting lower carbon emission goals:

“Nuclear power has significantly contributed to climate change mitigation by avoiding nearly 2 billion tonnes (metric tons) of carbon dioxide per year. For nuclear power to help limit global warming to 2o C by 2100, its capacity would need to match the high projection to avoid nearly 6.5 billion tonnes of greenhouse gas emissions by 2050.”

Among the small and medium size reactors (SMRs), IAEA noted that the following three were under construction in 2015: Argentina’s CAREM-25, Russia’s KLT-40S, and China’s HTR-PM. Another dozen SMRs were considered to be in the advanced design stage and potentially deployable in the near-term.

IAEA maintains its Advanced Reactors Information System (ARIS), as I reported in my 13 February 2015 post. This is a very comprehensive source of information on all types of advanced reactors. You can directly access ARIS at the following link:

https://aris.iaea.org

The “Nuclear Technology Review 2016” provides a useful overview of worldwide nuclear fuel cycle activities:

  • Worldwide uranium mining in more than 15 countries produced about 57,000 tonnes of Uranium (U) in 2015. Kazakhstan is the leading producer, followed by Canada.
  • Worldwide annual capacity for conversion of U to UF6 was about 60,000 tonnes in 2015, approximately matching annual demand. Canada, China, France, Russia, UK and U.S. operate conversion facilities.
  • Worldwide annual enriched light water reactor (LWR) fuel fabrication capacity is about 13,500 tonnes vs. an annual demand of about 7,000 tonnes. In addition, the fuel fabrication capacity for natural uranium fuel for pressurized heavy water reactors (PHWRs) is about 4,000 tonnes vs. a demand of 3,000 tonnes. Thirteen nations produce LWR fuel, and five produce PHWR fuel.
  • Spent fuel reprocessing is being carried out in 5 nations: China, France, India, Russia and UK; with France and Russia offering reprocessing services to international customers. France and UK have the greatest capacity, reprocessing about 1,000 t HM/year.
  • IAEA reported that, “by the end of 2015, (worldwide) spent fuel in storage amounted to around 266,000 tonnes of heavy metal (t HM) and is accumulating at a rate of around 7,000 t HM/year.
  • Several nations are planning or developing their own geologic disposal facilities for spent nuclear fuel

There’s a lot more information in the IAEA report, including information on fusion, accelerators, research reactors, and industrial and medical applications of nuclear technologies. You can download this IAEA report at the following link:

https://www.iaea.org/About/Policy/GC/GC60/GC60InfDocuments/English/gc60inf-2_en.pdf