Category Archives: Oil & gas

Marine Nuclear Power: 1939 – 2018

Peter Lobner

In 2015, I compiled the first edition of a resource document to support a presentation I made in August 2015 to The Lyncean Group of San Diego (www.lynceans.org) commemorating the 60thanniversary of the world’s first “underway on nuclear power” by USS Nautilus on 17 January 1955.  That presentation to the Lyncean Group, “60 years of Marine Nuclear Power: 1955 –2015,” was my attempt to tell a complex story, starting from the early origins of the US Navy’s interest in marine nuclear propulsion in 1939, resetting the clock on 17 January 1955 with USS Nautilus’ historic first voyage, and then tracing the development and exploitation of marine nuclear power over the next 60 years in a remarkable variety of military and civilian vessels created by eight nations.

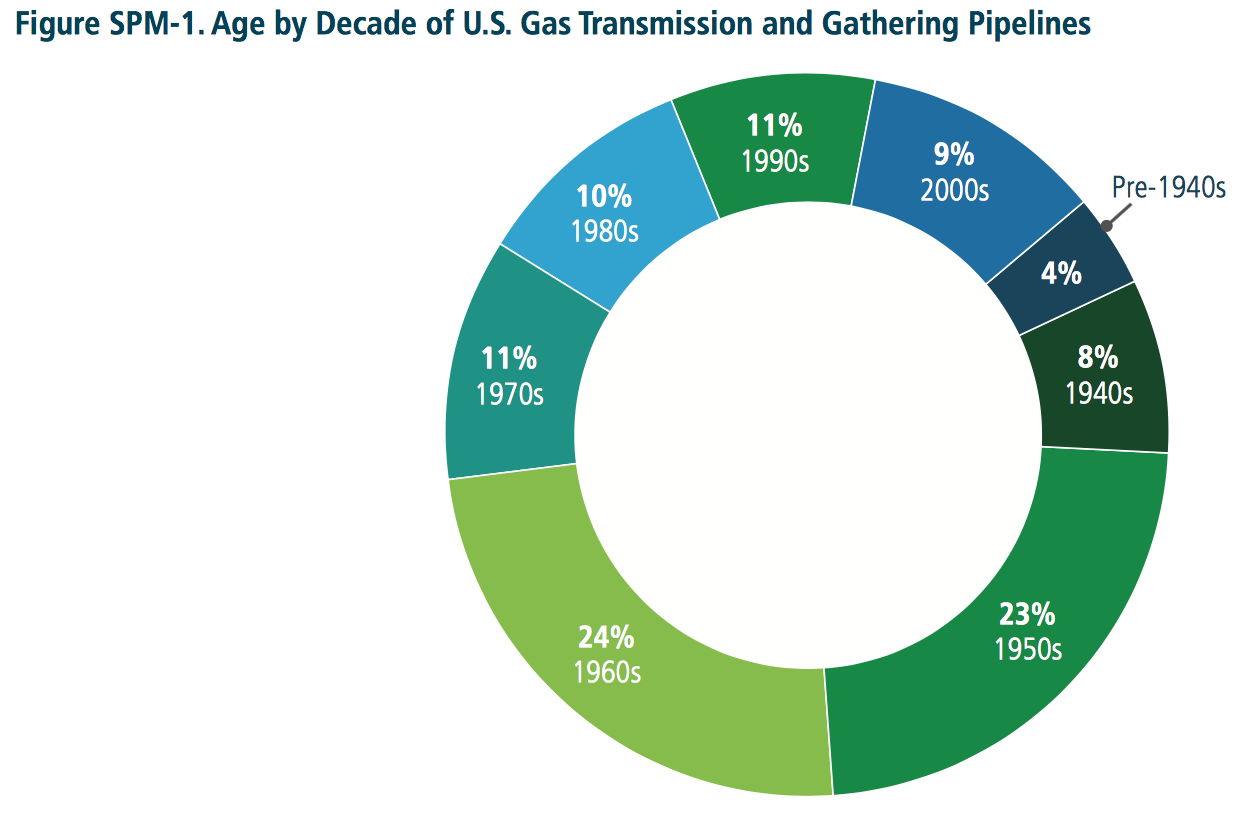
Here’s a quick overview of worldwide marine nuclear in 2018.

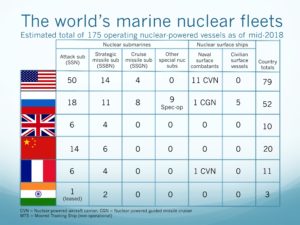
Source: two charts by author

In July 2018, I finished a complete update of the resource document and changed the title to, “Marine Nuclear Power: 1939 –2018.”  Due to its present size (over 2,100 pages), the resource document now consists of the following parts, all formatted as slide presentations:

  • Part 1: Introduction
  • Part 2A: United States – Submarines
  • Part 2B: United States – Surface Ships
  • Part 3A: Russia – Submarines
  • Part 3B: Russia – Surface Ships & Non-propulsion Marine Nuclear Applications
  • Part 4: Europe & Canada
  • Part 5: China, India, Japan and Other Nations
  • Part 6: Arctic Operations

The original 2015 resource document and this updated set of documents were compiled from unclassified, open sources in the public domain.

I acknowledge the great amount of work done by others who have published material in print or posted information on the internet pertaining to international marine nuclear propulsion programs, naval and civilian nuclear powered vessels, naval weapons systems, and other marine nuclear applications.  My resource document contains a great deal of graphics from many sources.  Throughout the document, I have identified the sources for these graphics.

You can access all parts of Marine Nuclear Power: 1939 – 2018 here:

Marine Nuclear Power 1939 – 2018_Part 1_Introduction

Marine Nuclear Power 1939 – 2018_Part 2A_USA_submarines

Marine Nuclear Power 1939 – 2018_Part 2B_USA_surface ships

Marine Nuclear Power 1939 – 2018_Part 3A_R1_Russia_submarines

Marine Nuclear Power 1939 – 2018_Part 3B_R1_Russia_surface ships & non-propulsion apps

Marine Nuclear Power 1939 – 2018_Part 4_Europe & Canada

Marine Nuclear Power 1939 – 2018_Part 5_China-India-Japan & Others

Marine Nuclear Power 1939 – 2018_Part 6 R1_Arctic marine nuclear

I hope you find this resource document informative, useful, and different from any other single document on this subject.  Below is an outline to help you navigate through the document.

Outline of Marine Nuclear Power:  1939 – 2018.

Part 1: Introduction

  • Quick look:  Then and now
  • State-of-the-art in 1955
  • Marine nuclear propulsion system basics
  • Timeline
    • Timeline highlights
    • Decade-by-decade
  • Effects of nuclear weapons and missile treaties & conventions on the composition and armament of naval fleets
  • Prospects for 2018 – 2030

Part 2A: United States – Submarines

  • Timeline for development of marine nuclear power in the US
  • US current nuclear vessel fleet
  • US naval nuclear infrastructure
  • Use of highly-enriched uranium (HEU) in US naval reactors
  • US submarine reactors and prototype facilities
  • US Navy nuclear-powered submarines
    • Nuclear-powered fast attack submarines (SSN)
      • Submarine-launched torpedoes, anti-submarine missiles & mines
      • Systems to augment submarine operational capabilities
    • Nuclear-powered strategic ballistic missile submarines (SSBN)
      • Submarine-launched strategic ballistic missiles (SLBMs)
    • Nuclear-powered guided missile submarines (SSGN)
      • Cruise missiles and other tactical guided missiles
    • Nuclear-powered special operations submarines

Part 2B: United States – Surface Ships

  • US naval surface ship reactors & prototype facilities
  • US Navy nuclear-powered surface ships
    • Evolution of the US nuclear-powered surface fleet
    • Nuclear-powered guided missile cruisers (CGN)
      • CGN tactical weapons
    • Nuclear-powered aircraft carriers (CVN)
      • Carrier strike group (CSG) & carrier air wing composition
  • Naval nuclear vessel decommissioning and nuclear waste management
  • US civilian marine nuclear vessels and reactors
    • Operational & planned civilian marine vessels and their reactors
    • Other US civilian marine reactor designs
  • Radioisotope Thermoelectric Generator (RTG) marine applications
  • US marine nuclear power current trends

Part 3A: Russia – Submarines

  • The beginning of the Soviet / Russian marine nuclear power program
  • Russian current nuclear vessel fleet.
  • Russian marine nuclear reactor & fuel-cycle infrastructure
  • Russian nuclear vessel design, construction & life-cycle infrastructure
  • Russian naval nuclear infrastructure
  • Russian nuclear-powered submarines
    • Submarine reactors
    • Nuclear-powered fast attack submarines (SSN)
      • Submarine-launched torpedoes & anti-submarine missiles
    • Strategic ballistic missile submarines (SSB & SSBN)
      • Submarine-launched ballistic missiles (SLBM)
    • Cruise missile submarines (SSG & SSGN).
      • Cruise missiles
    • Nuclear-powered special operations subs & strategic torpedoes
    • Other special-purpose nuclear-powered subs
    • Examples of un-built nuclear submarine projects

Part 3B: Russia – Surface Ships & Non-propulsion Marine Nuclear Applications

  • Russian nuclear-powered surface ships
    • Surface ship reactors
    • Nuclear-powered icebreakers
    • Nuclear-powered naval surface ships
      • Nuclear-powered guided missile cruisers
      • Nuclear-powered command ship
      • Nuclear-powered aircraft carrier
      • Nuclear-powered multi-purpose destroyer
  • Russian non-propulsion marine nuclear applications
    • Small reactors for non-propulsion marine nuclear applications
    • Floating nuclear power plants (FNPP)
    • Transportable reactor units (TRU)
    • Arctic seabed applications for marine nuclear power
    • Radioisotope Thermoelectric Generators (RTG)
  • Marine nuclear decommissioning and environmental cleanup
  • Russian marine nuclear power current trends

Part 4: Europe & Canada

  • Nations that operate or have operated nuclear vessels
    • United Kingdom
      • The beginning of the UK marine nuclear power program
      • UK current nuclear vessel fleet
      • UK naval nuclear infrastructure
      • UK naval nuclear reactors
      • UK Royal Navy nuclear-powered submarines
        • Nuclear-powered fast attack submarines (SSN)
          • Submarine-launched tactical weapons
        • Nuclear-powered strategic ballistic missile submarines (SSBN)
          • Submarine-launched ballistic missiles (SLBM)
      • UK disposition of decommissioned nuclear submarines
      • UK nuclear surface ship and marine reactor concepts
      • UK marine nuclear power current trends
    • France
      • The beginning of the French marine nuclear power program
      • French current nuclear vessel fleet
      • French naval nuclear infrastructure
      • French naval nuclear reactors
      • French naval nuclear vessels
        • Nuclear-powered strategic ballistic missile submarines (SNLE)
          • Submarine-launched ballistic missiles (MSBS)
        • Nuclear-powered fast attack submarines (SNA)
          • Submarine-launched tactical weapons
        • Nuclear-powered aircraft carrier
      • French disposition of decommissioned nuclear submarines
      • French non-propulsion marine reactor applications
      • French marine nuclear power current trends
    • Germany
  • Other nations with an interest in marine nuclear power technology
    • Italy
    • Sweden
    • Netherlands
    • Canada

Part 5: China, India, Japan and Other Nations

  • Nations that have operated nuclear vessels
    • China
      • The beginning of China’s marine nuclear power program
      • China’s current nuclear vessel fleet
      • China’s naval nuclear infrastructure
      • China’s nuclear vessels
        • Nuclear-powered fast attack submarines (SSNs)
          • Submarine-launched tactical weapons
        • Nuclear-powered strategic ballistic missile subs (SSBNs)
          • Submarine-launched ballistic missiles (SLBMs)
        • Floating nuclear power stations
        • Nuclear-powered surface ships
      • China’s decommissioned nuclear submarine status
      • China’s marine nuclear power current trends
    • India
      • The beginning of India’s marine nuclear power program
      • India’s current nuclear vessel fleet
      • India’s naval nuclear infrastructure
      • India’s nuclear-powered submarines
        • Nuclear-powered fast attack submarines (SSNs)
          • Submarine-launched tactical weapons
        • Nuclear-powered strategic ballistic missile submarines (SSBNs)
          • Submarine-launched ballistic missiles (SLBM).
      • India’s marine nuclear power current trends
    • Japan
  • Other nations with an interest in marine nuclear power technology
    • Brazil
    • North Korea
    • Pakistan
    • Iran
    • Israel
    • Australia

Part 6: Arctic Operations

  • Rationale for marine nuclear power in the Arctic
  • Orientation to the Arctic region
  • US Arctic policy
  • Dream of the Arctic submarine
  • US marine nuclear Arctic operations
  • UK marine nuclear Arctic operations
  • Canada marine nuclear ambitions
  • Russian marine nuclear Arctic operations
    • Russian non-propulsion marine nuclear Arctic applications
  • China’s marine nuclear ambitions
  • Current trends in marine nuclear Arctic operations

Periodic updates:

  • Parts 3A and 3B, Revision 1, were posted in October 2018
  • Part 6, Revision 1, was posted in February 2019

Critical Infrastructure: Oil and Gas Pipelines

Peter Lobner

Background on the oil and gas industry

In a 2013 report by the American Petroleum Institute (API) and PricewaterhouseCoopers (PwC) entitled, “Economic Impacts of the Oil and Natural Gas Industry on the US Economy in 2011,” it was reported that:

“Counting direct, indirect, and induced impacts, the industry’s total impact on labor income (including proprietors’ income) was $598 billion, or 6.3 percent of national labor income in 2011. The industry’s total impact on US GDP (gross domestic product) was $1.2 trillion, accounting for 8.0 percent of the national total in 2011.”

Table 1 of this report, which is reproduced below, defines the scope of the U.S. oil and natural gas industry included in this analysis.

Composition of oil & gas industry

In the table footnote you can see that the API – PwC economic assessment was limited to the oil and gas industry itself, and their results did not include the economic value of the many downstream businesses whose operations are dependent on one or more of the various products delivered by the oil and gas industry (i.e., plastic and synthetic material manufacturers, airlines, trucking, power plants, etc.). If we counted the economic values of these oil and/or gas dependent businesses, then the overall contribution of the oil and gas industry to the U.S. economy would be significantly higher than stated in the API – PwC report. You can get this report at the following link:

http://www.api.org/~/media/Files/Policy/Jobs/Economic_Impacts_ONG_2011.pdf

U.S. oil and gas pipeline infrastructure

Pipeline systems are a key element of the oil and gas industry infrastructure, enabling timely and efficient transportation of the following products:

  • Crude oil
  • Petroleum products from crude oil and other liquids processed at refineries, including transportation fuels, fuel oils for heating and electricity generation, asphalt and road oil, and various feedstocks for making chemicals, plastics, and synthetic materials
  • Hydrocarbon gas liquids (HGL), including natural gas liquids (paraffins or alkanes) and olefins (alkenes) produced by natural gas processing plants, fractionators, crude oil refineries, and condensate splitters, but excluding liquefied natural gas (LNG) and aromatics
  • Natural gas

The U.S. has over 200,000 miles of liquids pipelines that, in 2014, transported 16.2 billion barrels of crude oil, petroleum products and HGL. More than 17,000 miles of liquid pipelines were added to the network in the five-year period from 2010 thru 2014. The U.S. has over 300,000 miles of interstate and intrastate natural gas transmission pipelines. That’s adds up to more than a half million miles of major oil and gas pipelines in the U.S.

Most pipelines are installed underground, with pumping / compressor stations at grade level. The Trans-Alaska pipeline system is a notable exception, with its above-grade pipeline in permafrost regions.

The U.S. Energy Information Agency (EIA) maintains the U.S. Energy Mapping System, which is a geographic information system (GIS) that can display a great deal of energy infrastructure information. The user can select the map area to be viewed, the map style, and the data to be displayed on the map. Once you’ve created the map of your choice, you can zoom and scroll to explore map details. You can access the U.S. Energy Mapping System at the following link:

https://www.eia.gov/state/maps.cfm

The following maps prepared using the U.S. Energy Mapping System show the distribution of oil and gas pipeline systems in the U.S. (except Alaska & Hawaii) and Canada. The source of pipeline mileage data is the Pipeline and Hazardous Material Safety Administration (PHMSA). The source of liquid capacity data is the Association of Oil Pipe Lines (AOPL).

Crude oil pipelines:

  • 73,300 miles of interstate and intrastate pipelines in 2015 (PHMSA)
  • Delivered 9.3 billion barrels (bbl) of crude oil nationwide in 2014 (AOPL)

Crude oil pipelines

Petroleum product pipelines:

  • 62,588 miles of interstate and intrastate pipelines in 2015 (PHMSA)
  • The petroleum product pipelines and the HGL pipelines together delivered 6.9 billion barrels (bbl) of products nationwide in 2014 (AOPL).

Petroleum product pipeline 

HGL (natural gas liquids) pipelines: 

  • 67,577 miles of interstate and intrastate pipelines in 2015 (PHMSA)

 HLG pipeline

Natural gas pipelines:

  • 2,509,000 total miles of natural gas pipelines in 2015 (PHMSA)
    • 301,242 miles of interstate and intrastate transmission pipelines
    • 1.28 million miles of gas distribution main lines (smaller than the transmission pipelines)
    • 913,085 miles of gas distribution service lines
    • 17,727 miles of gathering mains that collect gas from wells and move it through a series of compression stages to the main transmission pipelines
  • Natural gas transmission pipeline capacity was approximately 443 billion cubic feet per day in 2011 (QER 1.1)

Natural gas pipelines

All of the above maps combined, including international border crossings:

Combined map

The high density of pipeline systems in many parts of the nation is evident in the last map. On the EIA’s U.S. Energy Mapping System website, you can recreate and explore any of the above maps.

Pipeline safety

The Department of Transportation’s (DOT) Pipeline and Hazardous Material Safety Administration (PHMSA), acting through the Office of Pipeline Safety (OPS), administers the DOT national regulatory program to assure the safe transportation of natural gas, petroleum, and other hazardous materials by pipeline.

PHMSA has collected pipeline incident reports since 1970. PHMSA defines “significant incidents” as any of the following conditions that originate within the pipeline system (but not initiated by a nearby external event that affects the pipeline system).

  • Fatality or injury requiring in-patient hospitalization
  • $50,000 or more in total costs, measured in 1984 dollars
  • Highly volatile liquid releases of 5 barrels (210 gallons) or more, or other liquid releases of 50 barrels (2,100 gallons) or more
  • Liquid releases resulting in an unintentional fire or explosion

PHMSA data are available at the following link:

http://www.phmsa.dot.gov/pipeline/library/data-stats

A summary of all reported pipeline incidents over the past 20 years is presented in the following PHMSA table.

PHMSA significant events table

The 20-year averages (1996 – 2015) are:

  • Incidents: 560
  • Fatalities: 18
  • Injuries: 69
  • Total cost: $343,109,598

The latest data for 2016 (possibly not final) are:

  • Incidents: 620
  • Fatalities: 17
  • Injuries: 82
  • Total cost: $275,341,057

Clearly, the oil and gas pipeline business is quite hazardous, and the economic cost of pipeline incidents is very high, even in an average year. Since the mid-1990s, the number of incidents per year has almost doubled (367 average for 1996 – 2000 vs. 641 average for 2011 – 2015) as has the total cost per year ($128.4 million average for 1996 – 2000 vs. $331.6 million average for 2011 – 2015).

In June 2015, Jonathan Thompson posted the article, “Mapping 7 Million Gallons of Crude Oil Spills,” on the High Country News website, at the following link:

http://www.hcn.org/articles/spilling-oil-santa-barbara/print_view

In this article, High Country News mapped the last five years of PHMSA data, which included more than 1,000 crude oil pipeline leaks and ruptures. Key points made in the High Country News article are

  • Over the five-year period, 168,000 barrels (more than 7 million gallons) of crude oil were spilled as a result of reported incidents. That’s an average of about 1.4 million gallons (33,600 barrels) per year leaking or spilled from 73,300 miles of crude oil pipelines that delivered 3 billion barrels of oil annually in 2014. That annualized amount of leakage also is equivalent to the amount of oil carried in about 47 DOT-111 rail cars.
  • Commonly reported causes included poor material condition (corrosion, bad seals), weather (heavy rains, lightning), and human error (valves being left open, people puncturing pipelines while digging).
  • Many of the spills were small, releasing less than 10 barrels (420 gallons) of oil, but a few were much larger. For example, a 2013 lightning strike on a North Dakota pipeline caused a 20,000-barrel (840,000 gallon) leak.

Cleanup after these spills and leaks is included in the PHMSA total cost data.

Aging infrastructure

Is August 2014, Jordan Wirfs-Brock posted the article, “Half Century Old Pipelines Carry Oil and Gas Load,” on the Inside Energy (IE) website at the following link:

http://insideenergy.org/2014/08/01/half-century-old-pipelines-carry-oil-and-gas-load/

Using PHMSA data, the author mapped the age of the U.S. pipeline infrastructure and determined that, “About forty-five percent of U.S. crude oil pipeline is more than fifty years old.” The following chart shows the age distribution of U.S. crude oil pipelines.

Crude pipeline age

In April 2015 Administration issued the First Installment of the Quadrennial Energy Review (QER 1.1). This report included the following chart showing the age distribution of U.S. natural gas transmission and gathering pipelines. It looks like more than 50% of these natural gas pipelines are more than 50 years old.

Gas pipeline age

Source: QER 1.1 Summary

The high percentage of older pipeline systems places the overall integrity, reliability and safety of the critical national pipeline infrastructure at risk.

Pipeline modernization

In a previous post, I described the Quadrennial Energy Review (QER) initiated by the Obama Administration in January 2014. The first QER report, QER 1.1, released in April 2015, provides a good overview of issues related to oil and gas pipeline system risks and opportunities to modernize this critical infrastructure.

One positive step was taken on 16 April 2015 by the Federal Energy Regulatory Commission (FERC) when it announced a new policy, Cost Recovery Mechanisms for Modernization of Natural Gas Facilities. This policy sets conditions for interstate natural gas pipeline operators to recover certain safety, environmental, or reliability capital expenditures made to modernize pipeline system infrastructure.

Given the scale of the national oil and gas pipeline infrastructure, and the age of significant portions of that infrastructure, it will take decades of investment to implement system-wide modernization. The political climate, economic climate, and maybe the stars need to be in alignment for this enormous, long-term modernization effort to deliver the needed results.

Quadrennial Energy Review

Peter Lobner

On 9 January 2014 the Administration launched a “Quadrennial Energy Review” (QER) to examine “how to modernize the Nation’s energy infrastructure to promote economic competitiveness, energy security, and environmental responsibility…” You can read the Presidential Memorandum establishing the QER at the following link:

https://www.whitehouse.gov/the-press-office/2014/01/09/presidential-memorandum-establishing-quadrennial-energy-review

You can get a good overview of the goals of the QER in a brief factsheet at the following link:

https://www.whitehouse.gov/the-press-office/2015/04/21/fact-sheet-administration-announces-new-agenda-modernize-energy-infrastr

On April 21, 2015, the QER Task Force released the “first installment” of the QER report entitled “Energy Transmission, Storage, and Distribution Infrastructure.” The Task Force announcement stated:

“The first installment (QER 1.1) examines how to modernize our Nation’s energy infrastructure to promote economic competitiveness, energy security, and environmental responsibility, and is focused on energy transmission, storage, and distribution (TS&D), the networks of pipelines, wires, storage, waterways, railroads, and other facilities that form the backbone of our energy system.”

The complete QER 1.1 report or individual chapters are available at the following link:

https://energy.gov/epsa/quadrennial-energy-review-first-installment

QER 1.1 contents are listed below:

QER 1.1 contentOn January 6, 2017, the QER Task Force released the “second installment” of the QER report entitled “Transforming the Nation’s Electricity System.” The Task Force announcement stated:

“The second installment (QER 1.2) finds the electricity system is a critical and essential national asset, and it is a strategic imperative to protect and enhance the value of the electricity system through modernization and transformation. QER 1.2 analyzes trends and issues confronting the Nation’s electricity sector out to 2040, examining the entire electricity system from generation to end use, and within the context of three overarching national goals: (1) enhance economic competitiveness; (2) promote environmental responsibility; and (3) provide for the Nation’s security.

The report provides 76 recommendations that seek to enable the modernization and transformation of the electricity system. Undertaken in conjunction with state and local governments, policymakers, industry, and other stakeholders, the recommendations provide the building blocks for longer-term, planned changes and activities.”

The complete QER 1.2 report or individual chapters are available at the following link:

https://energy.gov/epsa/quadrennial-energy-review-second-installment

QER 1.2 contents are listed below:

QER 1.2 contentI hope you take time to explore the QERs. I think the Task Force has collected a great deal of actionable information in the two reports. Converting this information into concrete actions will be a matter for the next Administration.