Category Archives: Power Generating Technology – Fossil

Many European Union (EU) “Green Deal” Energy Advocates are Hypocrites

Updated 16 December 2019, 20 March & 5 May 2020

Peter Lobner

In a 12 December 2019 NUCNET article, David Dalton, reporting on the United Nations Framework Convention on Climate Change (COP25) in Madrid, summarized the following points made by International Atomic Energy Agency (IAEA) director-general Rafael Mariano Grossi:

  • The world is “well off the mark” from reaching the climate goals of the Paris Agreement.
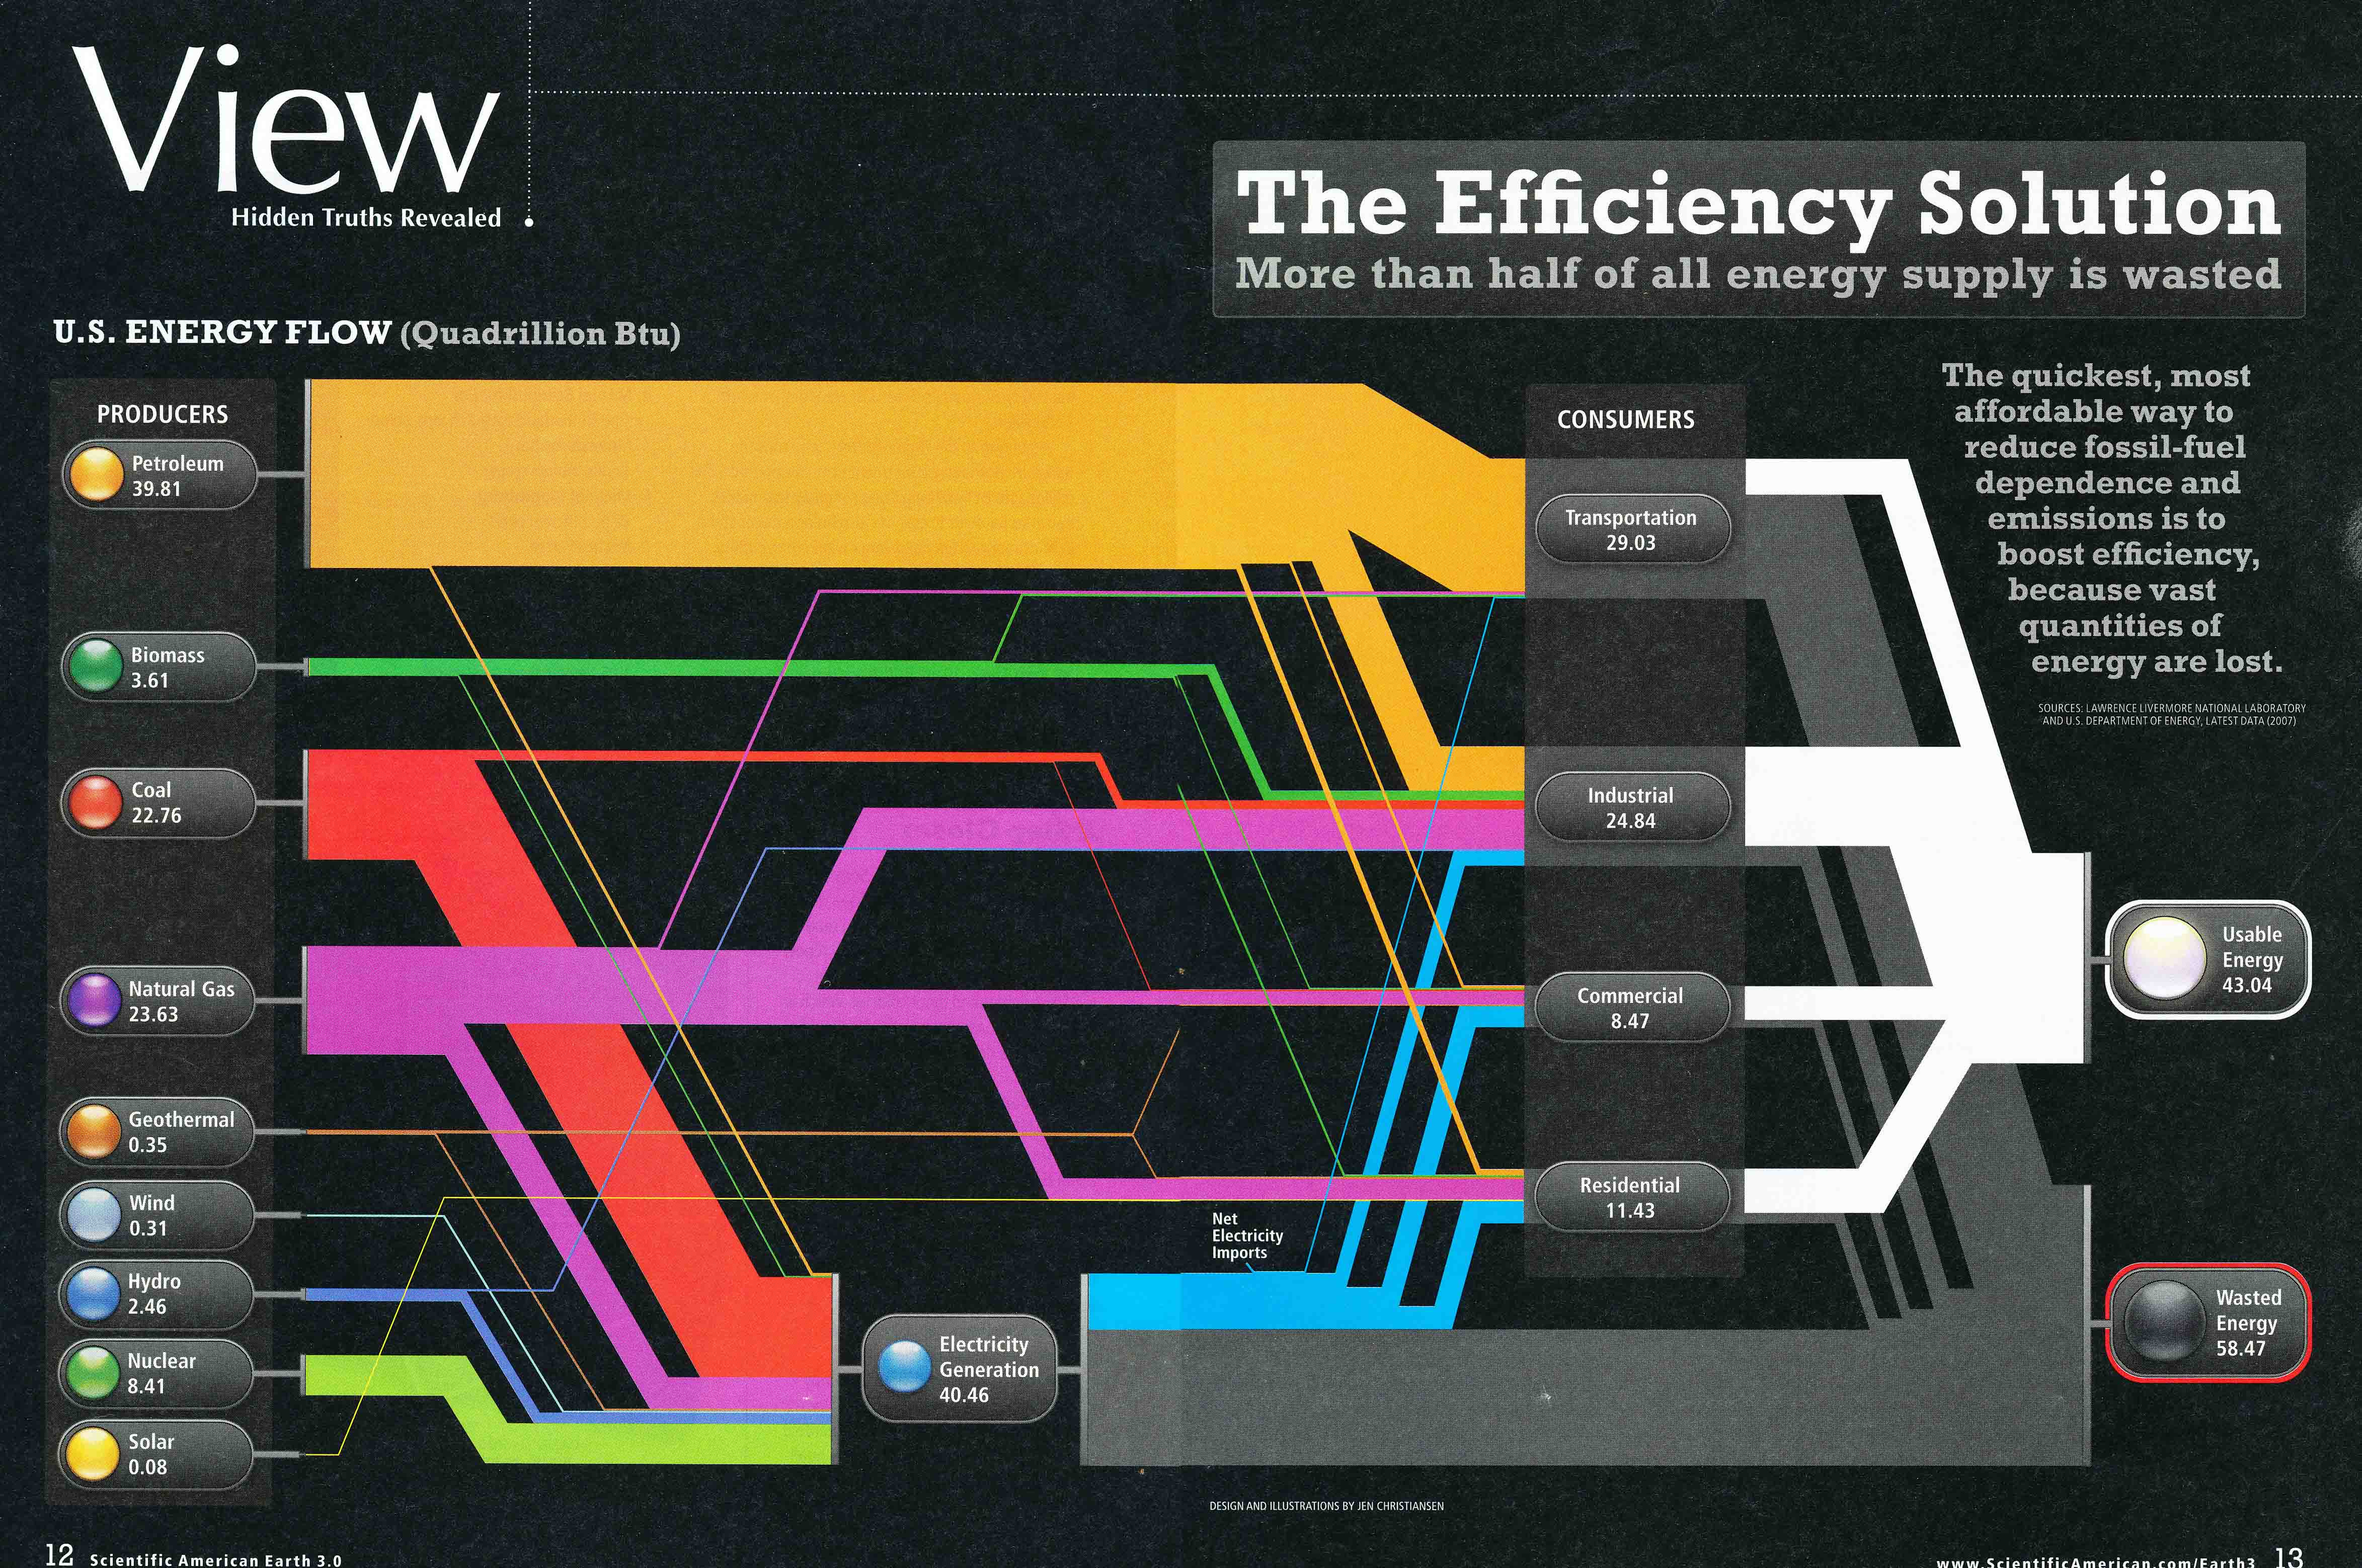
  • Around two-thirds of the world’s electricity still is generated through burning fossil fuels.
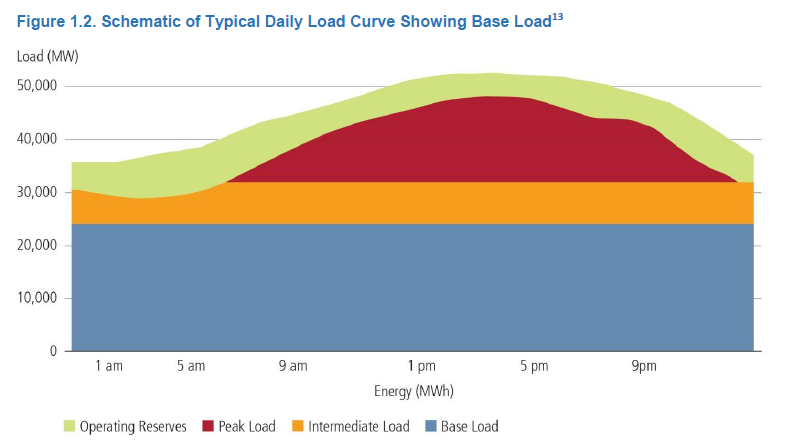
  • Greater use of low-carbon nuclear power is needed to ensure the global transition to clean energy includes a baseload backup to variable renewable energy sources such as solar and wind.
  • Greater deployment of a diverse mix of low-carbon sources such as hydro, wind and solar, as well as nuclear power, and battery storage, will be needed to reverse that trend and set the world on track to meet climate goals.

I concur with these points and feel that Mr. Grossi has laid out a reasonable and responsible position on the future role of nuclear power in “green” energy solutions that are focused on the primary goal of  reducing worldwide carbon dioxide emissions.  The commercial nuclear power industry has demonstrated the ability to reliably generate carbon-free electricity, 24 hours a day, seven days a week, in units of a thousand megawatts or more per power plant.  Except for the largest hydroelectric facilities, no other component of a carbon-neutral energy infrastructure offers such capabilities, which are essential for delivering 24/7 service to large users and stabilizing the grid.  Unfortunately, Mr. Grossi’s view is not shared by many EU energy advocates seeking to get member states to agree to the EU “Green Deal.”

You can read David Dalton’s complete article here:  https://www.nucnet.org/news/nuclear-and-renewables-are-not-in-competition-with-each-other-12-4-2019

The EU Energy Union and the “Green Deal”

The European Energy Union is the implementation of the 2019 Juncker Commission’s Priority #3 recommendation for a resilient energy union with a forward-looking climate change policy.  You can read a summary of the Commission’s recommendations here: http://www.europarl.europa.eu/RegData/etudes/IDAN/2019/637943/EPRS_IDA(2019)637943_EN.pdf

The Energy Union has quite a challenge, starting with the EU’s energy mix (circa 2016) as shown in the following chart:

EU 2016 energy mix.  Source:  EU Statistical Pocketbook 2018

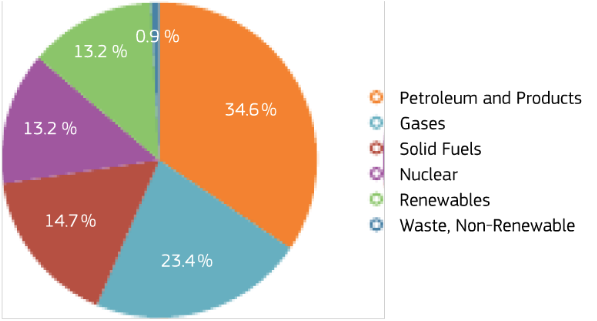
Complicating matters, the EU currently imports nearly 40% of its natural gas from Russia. 

The European Union’s Green Deal is described as “a new growth strategy that aims to transform the EU into a fair and prosperous society, with a modern, resource-efficient and competitive economy where there are no net emissions of greenhouse gases in 2050 and where economic growth is decoupled from resource use.”  You’ll find the EU’s 11 December 2019 detailed description of the Green Deal here: https://eur-lex.europa.eu/legal-content/EN/TXT/?qid=1576150542719&uri=COM%3A2019%3A640%3AFIN

For more information, see the EU “Green Deal” website here: https://ec.europa.eu/info/index_en

To enforce this “Green Deal,” the EU intends to adopt a “climate law” that is scheduled to be presented to Member States in March 2020.

The EU’s “Green Deal” is strongly biased against almost anything except renewable energy sources

On 11 December 2019, Reuters reported that, “European Union states have blocked a set of new rules governing which financial products can be called ‘green’ and ‘sustainable’, EU officials said, in a major setback for the bloc’s climate ambitions.”  The Reuters report noted that EU lawmakers wanted nuclear and fossil fuel funding clearly excluded from the definition of “green” investments. You can read this Reuters report here: https://af.reuters.com/article/commoditiesNews/idAFL8N28L3GD

This EU position is a particular problem for France, where nuclear power provided 71.7% of total French generating capacity in 2018 and about 90% of total electrical capacity was provided by low-carbon sources (nuclear + renewables).  In October 2019, Électricité de France announced that it is planning to make a decision in 2021 on building several more large nuclear power plants, which will be needed in the next decade as its oldest 900 MWe pressurized water reactor (PWR) plants start reaching their retirement age.

In contrast, nuclear power provided 11.8% of total German generating capacity in 2018 and about 47% of total electrical capacity was provided by low-carbon sources (nuclear + renewables), while 48.3% of total generating capacity was provided by a fossil fuel sources.  Germany plans to decommission the last of its seven remaining nuclear power plants, representing an aggregate of 9,256 MWe of carbon-free electric generating capacity, in the next three years, by December 2022.  It will be a challenge for new renewable energy sources to be deployed in time to make up for the lost carbon-free generating capacity from nuclear power.  It is notable that Germany gets 7% of its total generating capacity from burning biomass, which the EU, in its great wisdom, defines as a carbon-neutral renewable energy source.  More on that later.

How does the EU define “clean energy”?

The EU’s definition of “clean energy” is rather elusive.  On the EU Green Deal website, the Clean Energy fact sheet identifies the following three “key principle:” 

  • Prioritize energy efficiency and develop a power sector based largely on renewable sources
  • Secure and affordable EU energy supply
  • Fully integrated, interconnected and digitalized EU energy market

Only “renewable sources” are actually defined as sources for “clean energy.”  Nuclear power is not identified as a “clean” energy source.  I was unable to find on the EU Green Deal website any performance metrics related to “clean” energy source performance relative to carbon emissions.

Here’s the link to the EU Clean Energy Fact Sheet:  https://ec.europa.eu/commission/presscorner/detail/en/fs_19_6723

Another EU description of “clean energy” can be found the “Clean Energy for all Europeans” program, which focuses on the following:

  • Energy efficiency first, focusing on energy saving opportunities and “smarter” / “greener” buildings.
  • More renewables, with a new target of at least 32% in renewable energy by 2030
  • Better governance of the Energy Union, including a new energy “rulebook” under which each EU Member State drafts a National Energy and Climate Plan (NECP)
  • More rights for consumers to produce, store or sell their own energy
  • Smarter and more efficient electricity market

The Clean Energy for all Europeans program is described here: https://ec.europa.eu/info/news/clean-energy-all-europeans-package-completed-good-consumers-good-growth-and-jobs-and-good-planet-2019-may-22_en

The focus is on a distributed electric power infrastructure that takes advantage of many ways to improve energy efficiency, manage power consumption and generate power from distributed renewable energy sources.  Nuclear power is not mentioned at all in this document.  However, “large scale biopower” from agricultural and forest sources is addressed. 

How does the EU define “renewable energy sources”?

The latest EU directive on the promotion of energy use from renewable sources is Directive (EU) 2018/2001, dated 11 December 2018.  The definition of “renewable energy sources” traces back to Directive 2003/54/EC, dated 26 June 2003:

“Renewable energy sources” means renewable non-fossil energy sources (wind, solar, geothermal, wave, tidal, hydropower, biomass, landfill gas, sewage treatment plant gas and biogases)

So, fossil energy sources are excluded and nuclear energy sources are not included.

This seems logical but the devil is in the details.  The main problem is that EU energy policy equates “renewable” with being “carbon free,” when, for some renewable energy sources, this is far from the truth.  As an example, existing EU policy treats burning wood fuel in power plants as carbon-neutral while this fuel generates 15 to 20% more carbon dioxide per megawatt than the coal fuel it replaces.  This has resulted in a trend among EU coal-burning power plants to switch to wood pellets and claim the emission credit while actually polluting more than before.  See my 7 January 2017 post, “Hey, EU!! Wood may be a Renewable Energy Source, but it isn’t a Clean Energy Source,” for details.  The direct link to this post is here: https://lynceans.org/all-posts/hey-eu-wood-may-be-a-renewable-energy-source-but-it-isnt-a-clean-energy-source/

Fortunately, this matter may be on its way to being addressed in an EU court.  A 4 March 2019 article by Karen Savage, writing for Climate Liability News, reports, “The suit, which was filed in the European General Court in Luxembourg, asks the court to prevent EU countries from counting forest wood as a renewable energy source under the 2018 revised Renewable Energy Directive known as RED II.”  Major sources of wood pellets used in EU power plants are in the southeast U.S., where greatly increased logging activities are depleting established, slow-growth hardwood forests.  So the EU is OK with a “clean” energy policy that, in practice, increases current pollution locally in the EU while simultaneously stripping hardwood forests in a location outside of the EU. It seems to me that this is an environmental “double whammy” that can only make sense on paper, but not in practice.  You can read Karen Savage’s article here: https://www.climateliabilitynews.org/2019/03/04/biomass-european-union-lawsuit/

Conclusions

Regarding the EU Green Deal and Energy Union, I’m certain that the devil is in the details, and EU Member States need to have the opportunity to assess these details so there is no misunderstanding when EU climate laws are passed.  

The EU’s Green Deal has major flaws and needs to be recast to acknowledge the important role that nuclear power can play as a large, carbon-free source of electric power while also helping to ensure 24/7 grid stability.  Failing to recognize the role of nuclear power as a carbon-free source of electric power will serve to highlight the strong bias and hypocrisy of an EU energy leadership that has lost its way.  It also would serve as another example of why Brexit makes sense.

Even fossil power, with appropriate advanced environmental controls, should have a role in the Green Deal.  For example, a rapid shift away from coal to natural gas would significantly decrease near-term carbon dioxide emissions.  Similarly, abandoning the laughable EU policy on “carbon-neutral” biomass would eliminate a significant source of carbon dioxide emissions within the EU, and it would save environmentally valuable hardwood forests in the southeast U.S. and elsewhere.

Update: 16 December 2019 – Finally, some common sense prevailed, but only under very intense political pressure and, probably, fear of failure

In an article by Samuel Petrequin, “EU leaders include nuclear energy in green transition,” the Associated Press reported: 

“EU heads of state and government agreed that nuclear energy will be recognized as a way to fight climate change as part of a deal that endorsed the climate target. While Poland did not immediately agree to the plan, the concessions on nuclear energy were enough for the Czech Republic and Hungary to give their approval.  The two nations had the support of France, which relies on nuclear power for 60% of its electricity. They managed to break the resistance of skeptical countries, including Luxembourg, Austria and Germany to get a clear reference to nuclear power in the meeting’s conclusions. ‘Nuclear energy is clean energy,’ Czech Prime Minister Andrej Babiš said. ‘I don’t know why people have a problem with this.’”

You can read the complete AP article here: https://apnews.com/faae3503fe497af36e8d2e9a4d13b62a

The European Council memorandum contains only a single reference to “nuclear,” more in the form of a resigned acknowledgement rather than an endorsement.  

“The European Council acknowledges the need to ensure energy security and to respect the right of the Member States to decide on their energy mix and to choose the most appropriate technologies. Some Member States have indicated that they use nuclear energy as part of their national energy mix.”

You can read the European Council memorandum here: https://www.consilium.europa.eu/media/41768/12-euco-final-conclusions-en.pdf

Congratulations to the representatives from France, Czech Republic, Hungary, Poland and others for fighting the hard political fight and winning a place for nuclear power in the EU’s Green Deal.  But be watchful because the EU anti-nuclear forces are still there.

Update:  20 March 2020 – Yes, the EU anti-nuclear forces are still there.

On 10 March 2020 the European Commission issued a press release announcing its new industrial strategy, “Making Europe’s businesses future-ready: A new Industrial Strategy for a globally competitive, green and digital Europe.”  You can read the press release and download related documents here:  https://ec.europa.eu/commission/presscorner/detail/en/ip_20_416

While the plan highlights the need to “secure a sufficient and constant supply of low-carbon energy at competitive prices,” the word “nuclear” is notably absent from the EU’s industrial strategy.  Not much of a surprise, considering the EU’s behavior on the Green New Deal.

The next day, on 11 March, the Brussels-based nuclear industry group Foratom called on the EU decision-makers to support the nuclear sector’s important role within the EU economy.  Foratom’s Director General,  Yves Desbazeille, noted, “Not only is it (nuclear) low-carbon, it is also flexible, dispatchable and cost-effective”.

Foratom highlighted the following key attributes of nuclear energy in the context of the EU industrial strategy:

  • Maintain the competitiveness of Europe’s industry as energy often accounts for a significant share of manufacturing costs,
  • Decarbonize industry and thus contribute towards the 2050 carbon neutrality target,
  • Provide industry with the energy it needs when it needs it, which is particularly important for processes which run 24/7,
  • Other industries by offering alternative sources of decarbonized energy such as hydrogen and heat (sector coupling).

You can read Foratom’s complete statement here: https://www.foratom.org/press-release/foratom-calls-for-the-eu-to-recognise-nuclear-as-a-strategic-industry/

This is further evidence that EU nuclear energy advocates are fighting an uphill battle for recognition by the entrenched EU bureaucracy that nuclear power is a zero-carbon source of power and it can make an important (and maybe essential) contribution to meeting the EU’s 2050 carbon neutrality goal.

Best wishes to Foratom in their efforts to secure a place in the EU industrial strategy for nuclear power.

Update 5 May 2020 – More support for EU nuclear power

SNETP (Sustainable Nuclear Energy Technology Platform) was established in 2007, with EC support, as a group of non-governmental organizations that promote and coordinate research on nuclear fission.  

On 24 April 2020, SNETP sent a letter, endorsed by more than 100 organizations, to the Vice-presidents of the European Commission and the EU Commissioner for Energy calling for a “just and timely assessment of nuclear energy in the EU Taxonomy of Sustainable Finance.”

When enacted, the EU’sTaxonomy Regulation is intended to be a tool to guide future energy investments by providing investors with information on which activities and technologies contribute to the EU’s sustainability goals.  In their March 2020 final recommendations, the technical expert group (TEG) currently advising the EC on sustainable energy finance did not include nuclear power as a low-carbon and sustainable electricity source.

You can download the SNETP letter and see the logos of the many endorsing organizations here:  http://www.snetp.eu/wp-content/uploads/2020/04/NGO-Civil-society-on-Taxonomy-2020.pdf

Clearly, the battle lines have formed, with the anti-nuclear elements of the EU bureaucracy on one side and organizations like Foratom and SNETP on the other.  Against the behemoth EU bureaucracy, my best wishes go out to the underdogs, Foratom, SNETP, and other organizations and individuals that understand how nuclear power can play important roles in helping the EU achieve climate neutrality by 2050.

For more information:

A Look at the Declining US Coal Production and Coal-fired Power Generating Industries

Peter Lobner

US coal production was strong from the 1990s until 2014, with coal production each year being near or above 1 billion short tons (a “short ton” is 2,000 pounds). The highest annual level of production was achieved in 2008: 1.17 billion short tons. Since then, the coal industry has seen a steady decline in production, and trends indicate that the decline will continue.

In their 10 July 2019 report, “Almost all US coal production is consumed by electric power,” the US Energy Information Administration (EIA) reported that coal is still one of the main sources of energy in the US, accounting for 16% of the nation’s primary energy production in 2018. Nearly all of the coal consumed in the US is produced domestically, and most is consumed by the electric power sector to generate electricity, while some is exported.  The following EIA “coal flow” diagram shows where the coal comes from and (approximately) how it was consumed in 2018.  Total production was about 755 million short tons.  The electric power sector consumed about 84% of production, with only modest amounts being consumed by the industrial sector or exported.

You’ll find this EIA report here: https://www.eia.gov/todayinenergy/detail.php?id=39792

Electricity generation from coal has been on the decline in the US for almost two decades. On 26 June 2019, EIA reported that US electricity generation from renewables surpasses coal in April 2019. In the following EIA chart, you can see the long-term increase in generation from renewables, which contrasts sharply with the long-term decline of generation from coal due to the decommissioning of many coal-fired power plan and the commissioning of no plants since about 2014.

You can read this EIA announcement here:  https://www.eia.gov/todayinenergy/detail.php?id=39992

Between 2010 and the first quarter of 2019, US power companies announced the retirement of more than 546 coal-fired power units, totaling about 102 gigawatts (GW) of generating capacity. Plant owners intend to retire another 17 GW of coal-fired capacity by 2025.  You’ll find the EIA’s 26 July 2019 report on decommissioning US coal-fired power plants here:  https://www.eia.gov/todayinenergy/detail.php?id=40212

In April 2017, EIA reported that on the age of the US coal-fired generating plant fleet. The following chart shows the distribution of coal-fired plants based on their initial operating year.  EIA reported a fleet average age of 39 years in 2017.

You’ll find this EIA report here: https://www.eia.gov/todayinenergy/detail.php?id=30812

The following table lists EIA data on the numbers of different types of generating plants in the US between 2007 and 2017.  In 2007, the US had 606 coal-fired generating plants.  By the end of 2017, that number had dropped to 359.

You’ll find the EIA data here: https://www.eia.gov/electricity/annual/html/epa_04_01.html

In another decade, coal-fired generation will be only a small part of the US electric power generation portfolio and the average fleet age will be about 50 years old.  

Converting Carbon Dioxide into Useful Products

Peter Lobner

In my 19 December 2016 post, “What to do with Carbon Dioxide,” I provided an overview of the following three technologies being developed for underground storage (sequestration) or industrial utilization of carbon dioxide:

  • Store in basalt formations by making carbonate rock
  • Store in fractures in deep crystalline rock
  • Make ethanol

You can read this post here:

https://lynceans.org/all-posts/what-to-do-with-carbon-dioxide/

In the past two years, significant progress has been made in the development of processes to convert gaseous carbon dioxide waste streams into useful products.   This post is intended to highlight some of the advances being made and provide links to additional current sources of information on this subject.

1. Carbon XPrize:  Transforming carbon dioxide into valuable products

The NRG / Cosia XPrize is a $20 million global competition to develop breakthrough technologies that will convert carbon dioxide emissions from large point sources like power plants and industrial facilities into valuable products such as building materials, alternative fuels and other items used every day.  You’ll find details on this competition on the XPrize website at the following link:

https://www.xprize.org/prizes/carbon

As shown in the following timeline from the above website, this competition started in September 2015.

Carbon XPrize schedule

In April 2018, the following ten international teams were selected as finalists:

  • Four teams from Canada:  Carbicrete, Carbon Upcycling Technologies, CarbonCure and CERT
  • Three teams from USA:  C2CNT, Carbon Upcycling UCLA and Newlight
  • One team from UK:  Carbon Capture Machine
  • One team from India:  Breathe
  • One team from China:  C4X

The processes being developed by these teams will produce a range of valuable products:

You can read more about each of the competing teams and their intended products in the XPrize finalist selection report here:

https://assets-us-01.kc-usercontent.com/5cb25086-82d2-4c89-94f0-8450813a0fd3/ec5aba69-e68b-48c8-99b0-151e21749d67/XPRIZE%20Carbon%20Finalist%20Team%20Deck.pdf

The competition is now in the testing and certification phase.  Each team is expected to scale up their pilot systems by a factor of 10 for the operational phase, which starts in June 2019 at the Wyoming Integrated Test Center and the Alberta (Canada) Carbon Conversion Technology Center.  

The teams will be judged by the amount of carbon dioxide converted into usable products and the value of those products.  We’ll have to wait until the spring of 2020 for the results of this competition.

2. World’s largest post-combustion carbon capture project

Post-combustion carbon capture refers to capturing carbon dioxide from flue gas after a fossil fuel (e.g., coal, natural gas or oil) has been burned and before the flue gas is exhausted to the atmosphere.  You’ll find a 2016 review of post-combustion carbon capture technologies in the paper by Y. Wang, et al., “A Review of Post-combustion Carbon Dioxide  Capture Technologies from Coal-fired Power Plants,” which is available on the ScienceDirect website here:

https://reader.elsevier.com/reader/sd/pii/S1876610217313851?token=477195C9DBC9D5A1FCDBD7EB6CF04B595E1E377350690F4D2EC6E3D945DA570279962F3A75EE2B281A209A2F52B42A81

In January 2017, NRG Energy reported the completion of the Petra Nova post-combustion carbon capture project, which is designed to remove 90% of the carbon dioxide from a 240 MW “slipstream” of flue gas at the existing W. A. Parish generating plant Unit 8.  The “slipstream” represents 40% of the total flue gas flow from the coal-fired 610 MW Unit 8.  To date, this is the largest post-combustion carbon capture project in the world.  Approximately 1.4 million metric tons of carbon dioxide will be captured annually using a process jointly developed by Mitsubishi Heavy Industries, Ltd. (MHI) and the Kansai Electric Power Co.  The US Department of Energy (DOE) supported this project with a $190 million grant.

The DOE reported: “The project will utilize a proven carbon capture process, which uses a high-performance solvent for carbon dioxide absorption and desorption. The captured carbon dioxide will be compressed and transported through an 80 mile pipeline to an operating oil field where it will be utilized for enhanced oil recovery (EOR) and ultimately sequestered (in the ground).”

Process flow diagram for Petra Nova carbon dioxide capture and processing.  
Source: National Energy Technology Laboratory
The Petra Nova site.  Source: Petra Nova, a joint venture between NRG Energy and JX Nippon Oil & Gas Exploration
The Petra Nova large-scale carbon dioxide scrubber.  
Source: Business Wire

You’ll find more information on the Petra Nova project at the following links:

3. Pilot-scale projects to convert carbon dioxide to synthetic fuel

Thyssenkrupp pilot project for conversion of steel mill gases into methanol

In September 2018, Thyssenkrupp reported that it had “commenced production of the synthetic fuel methanol from steel mill gases. It is the first time anywhere in the world that gases from steel production – including the carbon dioxide they contain – are being converted into chemicals. The start-up was part of the Carbon2Chem project, which is being funded to the tune of around 60 million euros by Germany’s Federal Ministry of Education and Research (BMBF)……..‘Today the Carbon2Chem concept is proving its value in practice,’ said Guido Kerkhoff, CEO of Thyssenkrupp. ‘Our vision of virtually carbon dioxide-free steel production is taking shape.’”

You can read the Thyssenkrupp press release here:

https://www.thyssenkrupp.com/en/newsroom/press-releases/press-release-141984.html

Berkeley Laboratory developing a copper catalyst that yields high efficiency carbon dioxide-to-fuels conversion

The DOE Lawrence Berkeley National Laboratory (Berkeley Lab) has been engaged for many years in creating clean chemical manufacturing processes that can put carbon dioxide to good use.  In September 2017, Berkeley Lab announced that its scientists has developed a new electrocatalyst comprised of copper nanoparticles that can directly convert carbon dioxide into multi-carbon fuels and alcohols (e.g., ethylene, ethanol, and propanol) using record-low inputs of energy.  For more information, see the Global Energy World article here:

http://www.globalenergyworld.com/news/30336/copper_catalyst_yields_high_efficiency_co2-to-fuels_conversion.htm

4. Pilot-scale “Negative Emissions Technology” plants

The term negative emissions technology (NET) refers to an industrial processes designed to remove and sequester carbon dioxide directly from the ambient atmosphere rather than from a large point source of carbon dioxide generation (e.g. the flue gas from a fossil-fueled power generating station or a steel mill).  Think of a NET facility as a carbon dioxide removal “factory” that can be sited independently from the sources of carbon dioxide generation.

The Swiss firm Climeworks is in the business of developing carbon dioxide removal factories using the following process:

“Our plants capture atmospheric carbon with a filter. Air is drawn into the plant and the carbon dioxide within the air is chemically bound to the filter.  Once the filter is saturated with carbon dioxide it is heated (using mainly low-grade heat as an energy source) to around 100 °C (212 °F). The carbon dioxide is then released from the filter and collected as concentrated carbon dioxide gas to supply to customers or for negative emissions technologies.  Carbon dioxide-free air is released back into the atmosphere. This continuous cycle is then ready to start again. The filter is reused many times and lasts for several thousand cycles.”

This process is shown in the following Climeworks diagram:

Source: Climeworks

You’ll find more information on Climeworks on their website here:

http://www.climeworks.com

Climeworks NET in Iceland

In 2017, Climeworks began operation in Iceland of their first pilot facility to remove carbon dioxide from ambient air and produce concentrated carbon dioxide that is injected into underground basaltic rock formations, where the carbon dioxide gets converted into carbonite minerals in a relatively short period of time (1 – 2 years) and remains fixed in the rock.  Climeworks uses waste heat from a nearby geothermal generating plant to help run their carbon capture system.  This process is shown in the following diagram.

Source: Climeworks

This small-scale pilot facility is capable of removing only about 50 tons of carbon dioxide from the atmosphere per year, but can be scaled up to a much larger facility.  You’ll find more information on this Climeworks project here:

https://www.popularmechanics.com/science/green-tech/news/a28629/first-negative-emissions-plant/

Climeworks NET in Italy

In October 2018, Climeworks began operation in Italy of another pilot-scale NET facility designed to remove carbon dioxide from the atmosphere.  This facility is designed to remove 150 tons of carbon dioxide from the atmosphere per year and produce a natural gas product stream from the atmospheric carbon dioxide, water, and electricity.  You’ll find more information on this Climeworks project here:

https://www.popularmechanics.com/science/green-tech/a23621438/climeworks-co2-methane-facility/

5. Consensus reports on waste stream utilization and negative emissions technologies (NETs)

The National Academies Press (NAP) recently published a consensus study report entitled, “Gaseous Carbon Waste Streams Utilization, Status and Research Needs,”  which examines the following processes:

  • Mineral carbonation to produce construction material
  • Chemical conversion of carbon dioxide into commodity chemicals and fuels
  • Biological conversion (photosynthetic & non-photosynthetic) of carbon dioxide into commodity chemicals and fuels
  • Methane and biogas waste utilization

The authors note that, “previous assessments have concluded that …… > 10 percent of the current global anthropogenic carbon dioxide emissions….could feasibly be utilized within the next several decades if certain technological advancements are achieved and if economic and political drivers are in place.”

Source: National Academies Press

You can download a free pdf copy of this report here:

https://www.nap.edu/catalog/25232/gaseous-carbon-waste-streams-utilization-status-and-research-needs

Also on the NAP website is a prepublication report entitled, “Negative Emissions Technologies and Reliable Sequestration.” The authors note that NETs “can have the same impact on the atmosphere and climate as preventing an equal amount of carbon dioxide from being emitted from a point source.”

Source: National Academies Press

You can download a free pdf copy of this report here:

https://www.nap.edu/catalog/25259/negative-emissions-technologies-and-reliable-sequestration-a-research-agenda

In this report, the authors note that recent analyses found that deploying NETs may be less expensive and less disruptive than reducing some emissions at the source, such as a substantial portion of agricultural and land-use emissions and some transportation emissions. “ For example, NAPs could be a means for mitigating the methane generated from enteric fermentation in the digestive systems of very large numbers of ruminant animals (e.g., in the U.S., primarily beef and dairy cattle).  For more information on this particular matter, please refer to my 31 December 2016 post, “Cow Farts Could be Subject to Regulation Under a New California Law,” which you’ll find here:

https://lynceans.org/all-posts/cow-farts-could-be-subject-to-regulation-under-a-new-california-law/

The Importance of Baseload Generation and Real-Time Control to Grid Stability and Reliability

Peter Lobner

On 23 August 2017, the Department of Energy (DOE) issued a report entitled, “Staff Report to the Secretary on Energy Markets and Reliability.” In his cover letter, Energy Secretary Rick Perry notes:

“It is apparent that in today’s competitive markets certain regulations and subsidies are having a large impact on the functioning of markets, and thereby challenging our power generation mix. It is important for policy makers to consider their intended and unintended effects.”

Among the consequences of the national push to implement new generation capacity from variable renewable energy (VRE) resources (i.e., wind & solar) are: (1) increasing grid perturbations due to the variability of the output from VRE generators, and (2) early retirement of many baseload generating plants because of several factors, including the desire of many states to meet their energy demand with a generating portfolio containing a greater percentage of VRE generators. Grid perturbations can challenge the reliability of the U.S. bulk power systems that comprise our national electrical grid. The reduction of baseload capacity reduces the resilience of the bulk power system and its ability dampen these perturbations.

The DOE staff report contains the following typical daily load curve. Baseload plants include nuclear and coal that operate at high capacity factor and generally do not maneuver in response to a change in demand. The intermediate load is supplied by a mix of generators, including VRE generators, which typically operate at relatively low capacity factors. The peak load generators typically are natural gas power plants that can maneuver or be cycled (i.e., on / off) as needed to meet short-term load demand. The operating reserve is delivered by a combination of power plants that can be reliably dispatched if needed.

The trends in new generation additions and old generation retirements is summarized in the following graphic from the DOE staff report.

Here you can see that recent additions (since 2006) have focused on VRE generators (wind and solar) plus some new natural gas generators. In that same period, retirements have focused on oil, coal and nuclear generators, which likely were baseload generators.

The DOE staff report noted that continued closure of baseload plants puts areas of the country at greater risk of power outages. It offered a list of policy recommendations to reverse the trend, including providing power pricing advantages for baseload plants to continue operating, and speeding up and reducing costs for permitting for baseload power and transmission projects.

Regarding energy storage, the DOE staff report states the following in Section 4.1.3:

“Energy storage will be critical in the future if higher levels of VRE are deployed on the grid and require additional balancing of energy supply and demand in real time.”

“DOE has been investing in energy storage technology development for two decades, and major private investment is now active in commercializing and the beginnings of early deployment of grid-level storage, including within microgrids.”

Options for energy storage are identified in the DOE staff report.

You can download the DOE staff report to the Secretary and Secretary Perry’s cover letter here:

https://energy.gov/downloads/download-staff-report-secretary-electricity-markets-and-reliability

Lyncean members should recall our 2 August 2017 meeting and the presentation by Patrick Lee entitled, “A fast, flexible & coordinated control technology for the electric grid of the future.” This presentation described work by Sempra Energy and its subsidiary company PXiSE Energy Solutions to address the challenges to grid stability caused by VRE generators.   An effective solution has been demonstrated by adding energy storage and managing the combined output of the VER generators and the energy storage devices in real-time to match supply and demand and help stabilize the grid. This integrated solution, with energy storage plus real-time automated controls, appears to be broadly applicable to VRE generators and offers the promise, especially in Hawaii and California, for resilient and reliable electrical grids even with a high percentage of VRE generators in the state’s generation portfolio.

You can download Patrick Lee’s 2 August 2017 presentation to the Lyncean Group of San Diego at the following link:

https://lynceans.org/talk-113-8217/

Energy Literacy

Peter Lobner

I was impressed in 2007 by the following chart in Scientific American, which shows where our energy in the U.S. comes from and how the energy is used in electricity generation and in four consumer sectors. One conclusion is that more than half of our energy is wasted, which is clearly shown in the bottom right corner of the chart. However, this result shouldn’t be surprising.

2007 USA energy utilizationSource: Scientific American / Jen Christiansen, using LLNL & DOE 2007 data

The waste energy primarily arises from the efficiencies of the various energy conversion cycles being used. For example, the following 2003 chart shows the relative generating efficiencies of a wide range of electric power sources. You can see in the chart that there is a big plateau at 40% efficiency for many types of thermal cycle power plants. That means that 60% of the energy they used is lost as waste heat. The latest combined cycle plants have demonstrated net efficiencies as high as 62.22% (Bouchain, France, 2016, see details in my updated 17 March 2015 post, “Efficiency in Electricity Generation”).

Comparative generation  efficiencies-Eurelectric 2003Source: Eurelectric and VGB PowerTech, July 2003

Another source of waste is line loss in electricity transmission and distribution from generators to the end-users. The U.S. Energy Information Administration (EIA) estimates that electricity transmission and distribution losses average about 6% of the electricity that is transmitted and distributed.

There is an expanded, interactive, zoomable map of U.S. energy data that goes far beyond the 2007 Scientific American chart shown above. You can access this interactive map at the following link:

http://energyliteracy.com

The interactivity in the map is impressive, and the way it’s implemented encourages exploration of the data in the map. You can drill down on individual features and you can explore particular paths in much greater detail than you could in a physical chart containing the same information. Below are two example screenshots. The first screenshot is a top-level view. As in the Scientific American chart, energy sources are on the left and final disposition as energy services or waste energy is on the right. Note that waste energy is on the top right of the interactive map.

Energy literacy map 1

The second screenshot is a more detailed view of natural gas production and utilization.

Energy literacy map 2

As reported by Lulu Chang on the digitaltrends.com website, this interactive map was created by Saul Griffith at the firm Otherlab (https://otherlab.com). You can read her post at the following link:

http://www.digitaltrends.com/home/otherlab-energy-chart/

I hope you enjoy exploring the interactive energy literacy map.

Quadrennial Energy Review

Peter Lobner

On 9 January 2014 the Administration launched a “Quadrennial Energy Review” (QER) to examine “how to modernize the Nation’s energy infrastructure to promote economic competitiveness, energy security, and environmental responsibility…” You can read the Presidential Memorandum establishing the QER at the following link:

https://www.whitehouse.gov/the-press-office/2014/01/09/presidential-memorandum-establishing-quadrennial-energy-review

You can get a good overview of the goals of the QER in a brief factsheet at the following link:

https://www.whitehouse.gov/the-press-office/2015/04/21/fact-sheet-administration-announces-new-agenda-modernize-energy-infrastr

On April 21, 2015, the QER Task Force released the “first installment” of the QER report entitled “Energy Transmission, Storage, and Distribution Infrastructure.” The Task Force announcement stated:

“The first installment (QER 1.1) examines how to modernize our Nation’s energy infrastructure to promote economic competitiveness, energy security, and environmental responsibility, and is focused on energy transmission, storage, and distribution (TS&D), the networks of pipelines, wires, storage, waterways, railroads, and other facilities that form the backbone of our energy system.”

The complete QER 1.1 report or individual chapters are available at the following link:

https://energy.gov/epsa/quadrennial-energy-review-first-installment

QER 1.1 contents are listed below:

QER 1.1 contentOn January 6, 2017, the QER Task Force released the “second installment” of the QER report entitled “Transforming the Nation’s Electricity System.” The Task Force announcement stated:

“The second installment (QER 1.2) finds the electricity system is a critical and essential national asset, and it is a strategic imperative to protect and enhance the value of the electricity system through modernization and transformation. QER 1.2 analyzes trends and issues confronting the Nation’s electricity sector out to 2040, examining the entire electricity system from generation to end use, and within the context of three overarching national goals: (1) enhance economic competitiveness; (2) promote environmental responsibility; and (3) provide for the Nation’s security.

The report provides 76 recommendations that seek to enable the modernization and transformation of the electricity system. Undertaken in conjunction with state and local governments, policymakers, industry, and other stakeholders, the recommendations provide the building blocks for longer-term, planned changes and activities.”

The complete QER 1.2 report or individual chapters are available at the following link:

https://energy.gov/epsa/quadrennial-energy-review-second-installment

QER 1.2 contents are listed below:

QER 1.2 contentI hope you take time to explore the QERs. I think the Task Force has collected a great deal of actionable information in the two reports. Converting this information into concrete actions will be a matter for the next Administration.

What to do with Carbon Dioxide

Peter Lobner

In my 17 December 2016 post, “Climate Change and Nuclear Power,” there is a chart that shows the results of a comparative life cycle greenhouse gas (GHG) analysis for 10 electric power-generating technologies. In that chart, it is clear how carbon dioxide capture and storage technologies can greatly reduce the GHG emissions from gas and coal generators.

An overview of carbon dioxide capture and storage technology is presented in a December 2010 briefing paper issued by the London Imperial College. This paper includes the following process flow diagram showing the capture of CO2 from major sources, use or storage of CO2 underground, and use of CO2 as a feedstock in other industrial processes. Click on the graphic to enlarge.

Carbon capture and storage process

You can download the London Imperial College briefing paper at the following link:

https://www.imperial.ac.uk/media/imperial-college/grantham-institute/public/publications/briefing-papers/Carbon-dioxide-storage—-Grantham-BP-4.pdf

Here is a brief look at selected technologies being developed for underground storage (sequestration) and industrial utilization of CO2.

Store in basalt formations by making carbonate rock

Iceland generates about 85% of its electric power from renewable resources, primarily hydro and geothermal. Nonetheless, Reykjavik Energy initiated a project called CarbFix at their 303 MWe Hellisheidi geothermal power plant to control its rather modest CO2 emissions along with hydrogen sulfide and other gases found in geothermal steam.

Hellisheidi geothermal power plantHellisheidi geothermal power plant. Source: Power Technology

The process system collects the CO2 and other gases, dissolves the gas in large volumes of water, and injects the water into porous, basaltic rock 400 – 800 meters (1,312 – 2,624 feet) below the surface. In the deep rock strata, the CO2 undergoes chemical reactions with the naturally occurring calcium, magnesium and iron in the basalt, permanently immobilizing the CO2 as environmentally benign carbonates. There typically are large quantities of calcium, magnesium and iron in basalt, giving a basalt formation a large CO2 storage capacity.

The surprising aspect of this process is that the injected CO2 was turned into hard rock very rapidly. Researchers found that in two years, more that 95% of the CO2 injected into the basaltic formation had been turned into carbonate.

For more information, see the 9 June 2016 Washington Post article by Chris Mooney, “This Iceland plant just turned carbon dioxide into solid rock — and they did it super fast,” at the following link:

https://www.washingtonpost.com/news/energy-environment/wp/2016/06/09/scientists-in-iceland-have-a-solution-to-our-carbon-dioxide-problem-turn-it-into-stone/?utm_term=.886f1ca92c56

The author notes,

“The researchers are enthusiastic about their possible solution, although they caution that they are still in the process of scaling up to be able to handle anything approaching the enormous amounts of carbon dioxide that are being emitted around the globe — and that transporting carbon dioxide to locations featuring basalt, and injecting it in large volumes along with even bigger amounts of water, would be a complex affair.”

Basalt formations are common worldwide, making up about 10% of continental rock and most of the ocean floor. Iceland is about 90% basalt.

Detailed results of this Reykjavik Energy project are reported in a May 2016 paper by J.M. Matter, M. Stute, et al., Rapid carbon mineralization for permanent disposal of anthropogenic carbon dioxide emissions,” which is available on the Research Gate website at the following link:

https://www.researchgate.net/publication/303450549_Rapid_carbon_mineralization_for_permanent_disposal_of_anthropogenic_carbon_dioxide_emissions

Similar findings were made in a separate pilot project in the U.S. conducted by Pacific Northwest National Laboratory and the Big Sky Carbon Sequestration Partnership. In this project, 1,000 tons of pressurized liquid CO2 were injected into a basalt formation in eastern Washington state in 2013. Samples taken two years later confirmed that the CO2 had been converted to carbonate minerals.

These results were published in a November 2016 paper by B. P McGrail, et al., “Field Validation of Supercritical CO2 Reactivity with Basalts.” The abstract and the paper are available at the following link:

http://pubs.acs.org/doi/pdf/10.1021/acs.estlett.6b00387

Store in fractures in deep crystalline rock

Lawrence Berkeley National Laboratory has established an initiative dubbed SubTER (Subsurface Technology and Engineering Research, Development and Demonstration Crosscut) to study how rocks fracture and to develop a predictive understanding of fracture control. A key facility is an observatory set up 1,478 meters (4,850 feet) below the surface in the former Homestake mine near Lead, South Dakota (note: Berkeley shares this mine with the neutrino and dark matter detectors of the Sanford Underground Research Facility). The results of the Berkeley effort are expected to be applicable both to energy production and waste storage strategies, including carbon capture and sequestration.

You can read more about this Berkeley project in the article, “Underground Science: Berkeley Lab Digs Deep For Clean Energy Solutions,” on the Global Energy World website at the following link:

http://www.newswise.com/articles/view/663141/?sc=rssn&utm_source=feedburner&utm_medium=feed&utm_campaign=Feed%3A+NewswiseScinews+%28Newswise%3A+SciNews%29

Make ethanol

Researchers at the Department of Energy’s Oak Ridge National Laboratory (ORNL) have defined an efficient electrochemical process for converting CO2 into ethanol. While direct electrochemical conversion of CO2 to useful products has been studied for several decades, the yields of most reactions have been very low (single-digit percentages) and some required expensive catalysts.

Key points about the new process developed by ORNL are:

  • The electro-reduction process occurs in CO2 saturated water at ambient temperature and pressure with modest electrical requirements
  • The nanotechnology catalyst is made from inexpensive materials: carbon nanospike (CNS) electrode with electro-nucleated copper nanoparticles (Cu/CNS). The Cu/CNS catalyst is unusual because it primarily produces ethanol.
  • Process yield (conversion efficiency from CO2 to ethanol) is high: about 63%
  • The process can be scaled up.
  • A process like this could be used in an energy storage / conversion system that consumes extra electricity when it’s available and produces / stores ethanol for later use.

You can read more on this process in the 19 October 2016 article, “Scientists just accidentally discovered a process that turns CO2 directly into ethanol,” on the Science Alert website at the following link

http://www.sciencealert.com/scientists-just-accidentally-discovered-a-process-that-turns-co2-directly-into-ethanol

The full paper is available on the Chemistry Select website at the following link:

http://onlinelibrary.wiley.com/doi/10.1002/slct.201601169/full

International Energy Agency (IEA) Assesses World Energy Trends

Peter Lobner

The IEA issued two important reports in late 2016, brief overviews of which are provided below.

World Energy Investment 2016 (WEI-2016)

In September 2016, the IEA issued their report, “World Energy Investment 2016,” which, they state, is intended to addresses the following key questions:

  • What was the level of investment in the global energy system in 2015? Which countries attracted the most capital?
  • What fuels and technologies received the most investment and which saw the biggest changes?
  • How is the low fuel price environment affecting spending in upstream oil and gas, renewables and energy efficiency? What does this mean for energy security?
  • Are current investment trends consistent with the transition to a low-carbon energy system?
  • How are technological progress, new business models and key policy drivers such as the Paris Climate Agreement reshaping investment?

The following IEA graphic summarizes key findings in WEI-2016 (click on the graphic to enlarge):

WEI-2016

You can download the Executive Summary of WEI-2016 at the following link:

https://www.iea.org/newsroom/news/2016/september/world-energy-investment-2016.html

At this link, you also can order an individual copy of the complete report for a price (between €80 – €120).

You also can download a slide presentation on WEI 2016 at the following link:

https://csis-prod.s3.amazonaws.com/s3fs-public/event/161025_Laszlo_Varro_Investment_Slides_0.pdf

World Energy Outlook 2016 (WEO-2016)

The IEA issued their report, “World Energy Outlook 2016,” in November 2016. The report addresses the expected transformation of the global energy mix through 2040 as nations attempt to meet national commitments made in the Paris Agreement on climate change, which entered into force on 4 November 2016.

You can download the Executive Summary of WEO-2016 at the following link:

https://www.iea.org/newsroom/news/2016/november/world-energy-outlook-2016.html

At this link, you also can order an individual copy of the complete report for a price (between €120 – €180).

The following IEA graphic summarizes key findings in WEO-2016 (click on the graphic to enlarge):

WEO-2016

U.S. Energy Information Administration’s (EIA) Early Release of a Summary of its Annual Energy Outlook (AEO) Provides a Disturbing View of Our Nation’s Energy Future

Peter Lobner

Each year, the EIA issues an Annual Energy Outlook that provides energy industry recent year data and projections for future years. The 2016 AEO includes actual data of 2014 and 2015, and projections to 2040. These data include:

  • Total energy supply and disposition demand
  • Energy consumption by sector and source
  • Energy prices by sector and source
  • Key indicators and consumption by sector (Residential, Commercial, Industrial, Transportation)
  • Electricity supply, disposition, prices and emissions
  • Electricity generating capacity
  • Electricity trade

On 17 May, EIA released a PowerPoint summary of AEO2016 along with the data tables used in this Outlook.   The full version of AEO2016 is scheduled for release on 7 July 2016.

You can download EIA’s Early Release PowerPoint summary and any of the data tables at the following link:

http://www.eia.gov/forecasts/aeo/er/index.cfm

EIA explains that this Summary features two cases: the Reference case and a case excluding implementation of the Clean Power Plan (CPP).

  • Reference case: A business-as-usual trend estimate, given known technology and technological and demographic trends. The Reference case assumes Clean Power Plan (CPP) compliance through mass-based standards (emissions reduction in metric tones of carbon dioxide) modeled using allowances with cooperation across states at the regional level, with all allowance revenues rebated to ratepayers.
  • No CPP case: A business-as-usual trend estimate, but assumes that CPP is not implemented.

You can find a good industry assessment of the AEO2016 Summary on the Global Energy World website at the following link:

http://www.globalenergyworld.com/news/24141/Obama_Administration_s_Electricity_Policies_Follow_the_Failed_European_Model.htm

A related EIA document that is worth reviewing is, Assumptions to the Annual Energy Outlook 2015, which you will find at the following link:

http://www.eia.gov/forecasts/aeo/assumptions/

This report presents the major assumptions of the National Energy Modeling System (NEMS) used to generate the projections in AE02015. A 2016 edition of Assumptions is not yet available. The functional organization of NEMS is shown below.

EIA NEMS

The renewable fuels module in NEMS addresses solar (thermal and photovoltaic), wind (on-shore and off-shore), geothermal, biomass, landfill gas, and conventional hydroelectric.

The predominant renewable sources are solar and wind, both of which are intermittent sources of electric power generation. Except for the following statements, the EIA assumptions are silent on the matter of energy storage systems that will be needed to manage electric power quality and grid stability as the projected use of intermittent renewable generators grows.

  • All technologies except for storage, intermittents and distributed generation can be used to meet spinning reserves
  • The representative solar thermal technology assumed for cost estimation is a 100-megawatt central-receiver tower without integrated energy storage
  • Pumped storage hydroelectric, considered a nonrenewable storage medium for fossil and nuclear power, is not included in the supply

In my 4 March 2016 post, “Dispatchable Power from Energy Storage Systems Help Maintain Grid Stability,” I addressed the growing importance of such storage systems as intermittent power generators are added to the grid. In the context of the AEO, the EIA fails to address the need for these costly energy storage systems and they fail to allocate the cost of energy storage systems to the intermittent generators that are the source of the growing demand for the energy storage systems. As a result, the projected price of energy from intermittent renewable generators is unrealistically low in the AEO.

Oddly, NEMS does not include a “Nuclear Fuel Module.” Nuclear power is represented in the Electric Market Module, but receives no credit as a non-carbon producing source of electric power. As I reported in my posts on the Clean Power Plan, the CPP gives utilities no incentives to continue operating nuclear power plants or to build new nuclear power plants (see my 27 November 2015 post, “Is EPA Fudging the Numbers for its Carbon Regulation,” and my 2 July 2015 post, “EPA Clean Power Plan Proposed Rule Does Not Adequately Recognize the Role of Nuclear Power in Greenhouse Gas Reduction.”). With the current and expected future low price of natural gas, nuclear power operators are at a financial disadvantage relative to operators of large central station fossil power plants. This is the driving factor in the industry trend of early retirement of existing nuclear power plants.

The following 6 May 2016 announcement by Exelon highlights the current predicament of a high-performing nuclear power operator:

“Exelon deferred decisions on the future of its Clinton and Quad Cities plants last fall to give policymakers more time to consider energy market and legislative reforms. Since then, energy prices have continued to decline. Despite being two of Exelon’s highest-performing plants, Clinton and Quad Cities have been experiencing significant losses. In the past six years, Clinton and Quad Cities have lost more than $800 million, combined.“

“Exelon announced today that it will need to move forward with the early retirements of its Clinton and Quad Cities nuclear facilities if adequate legislation is not passed during the spring Illinois legislative session, scheduled to end on May 31 and if, for Quad Cities, adequate legislation is not passed and the plant does not clear the upcoming PJM capacity auction later this month.”

“Without these results, Exelon would plan to retire Clinton Power Station in Clinton, Ill., on June 1, 2017, and Quad Cities Generating Station in Cordova, Ill., on June 1, 2018.”

You can read Exelon’s entire announcement at the following link:

http://www.exeloncorp.com/newsroom/exelon-statement-on-early-retirement-of-clinton-and-quad-cities-nuclear-facilities

Together the Clinton and Quad Cities nuclear power plants have a combined Design Electrical Rating of 2,983 MWe from a non-carbon producing source. For the period 2013 – 2015, the U.S. nuclear power industry as a whole had a net capacity factor of 90.41. That means that the nuclear power industry delivered 90.41% of the DER of the aggregate of all U.S. nuclear power plants. The three Exelon plants being considered for early retirement exceeded this industry average performance with the following net capacity factors: Quad Cities 1 @ 101.27; Quad Cities 2 @ 92.68, and Clinton @ 91.26.

For the same 2013 – 2015 period, EIA reported the following net capacity factors for wind (32.96), solar photovoltaic (27.25), and solar thermal (21.25).  Using the EIA capacity factor for wind generators, the largest Siemens D7 wind turbine, which is rated at 7.0 MWe, delivers an average output of about 2.3 MWe. We would need more than 1,200 of these large wind turbines just to make up for the electric power delivered by the Clinton and Quad Cities nuclear power plants. Imagine the stability of that regional grid.

CPP continues subsidies to renewable power generators. In time, the intermittent generators will reduce power quality and destabilize the electric power grid unless industrial-scale energy storage systems are deployed to enable the grid operators to match electricity supply and demand with reliable, dispatchable power.

As a nation, I believe we’re trending toward more costly electricity with lower power quality and reliability.

I hope you share my concerns about this trend.

Is EPA Fudging the Numbers for its Carbon Regulation?

Peter Lobner

In my 2 July 2015 post, I commented on significant deficiencies in the U.S. Environmental Protection Agency (EPA) Clean Power Plan proposed rule. On 3 August 2015, the EPA announced the final rule. You can read the final rule for existing power plants, the EPA’s regulatory impact analysis, and associated fact sheets at the following link:

http://www2.epa.gov/cleanpowerplan/clean-power-plan-existing-power-plants

The Institute for Energy Research (IER) is a not-for-profit organization that conducts research and analysis on the functions, operations, and government regulation of global energy markets. The IER home page is at the following link:

http://instituteforenergyresearch.org

On 24 November 2015, the IER published an insightful article entitled, Is EPA Fudging the Numbers for its Carbon Regulation?, which I believe is worth your attention. The IER’s main points are:

  1. U.S. Energy Information Agency’s (EIA) Annual Energy Outlook (AEO) is the data source usually used by federal government agencies in their analysis of energy issues.
  2. EPA stands out as an exception. It frequently chooses not to use EIA data, and instead develops it’s own duplicative, different data.
  3. In the case of the Clean Power Plan, the EPA’s own data significantly underestimates the number of coal plants that need to be retired to comply with the Plan. The result is a much lower estimate of the economic impact of the Plan than if EIA data had been used.

It appears to me that the EPA created and used data skewed to produce a more favorable, but likely unrealistic, estimate of the economic impact that will borne by the U.S. power industry and power customers as the Clean Power Plan is implemented. Form your own opinion after reading the full IER article at the following link:

http://instituteforenergyresearch.org/analysis/is-epa-fudging-the-numbers-for-its-carbon-regulation/

Update 19 Feb 2016

On 8 February 2016, the American Nuclear Society (ANS) released their, “Nuclear in the States Toolkit Version 1.0 – Policy Options for States Considering the Role of Nuclear Power in Their Energy Mix.” The toolkit catalogs policies related to new and existing nuclear reactors for state policymakers to consider as they draft their Clean Power Plan compliance strategies.   The Toolkit identifies a range of policy options that individually or in aggregate can make nuclear generation a more attractive generation alternative for states and utilities.

You can download this document at the following link:

http://nuclearconnect.org/wp-content/uploads/2016/02/ANS-NIS-Toolkit-download.pdf

On 9 February 2016, the U.S. Supreme Court issues a stay on implementation of the EPA’s Clean Power Plan (CPP) pending the resolution of legal challenges to the program in court.

The ANS noted that, “….the stay provides them (the states) an opportunity to take a new look at the carbon offsets that existing nuclear plants provide, which they weren’t encouraged to do under the CPP rules.”