Category Archives: Power Generating Technology – Alternate

Floating Wave-powered Generators Offer the Potential for Commercial-scale Energy Harvesting From the Ocean

Peter Lobner

The idea of extracting energy from wave motion in the open ocean is not a new one. This energy source is renewable and relatively persistent in comparison to wind and solar power. However, no commercial-scale wave power generator currently is in operation anywhere in the world. The primary issues hindering deployment of this technology are:

  • the complexity of harnessing wave power
  • the long-term impact of the harsh ocean environment (storms, constant pounding from the sea, corrosive effects of salt water) on the generating equipment
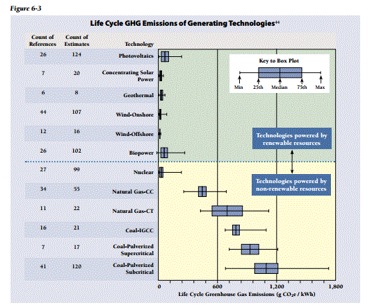
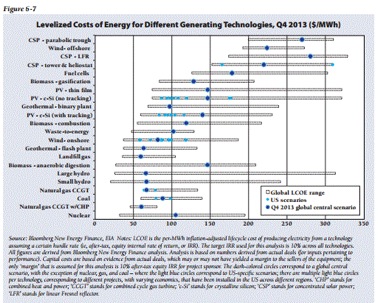
  • the high cost of generating electricity from wave power relative to almost all other energy sources, including wind and solar

In April 2014, Dave Levitan posted an article entitled, “Why Wave Power Has Lagged Far Behind as Energy Source,” on the Environment360 website. You can read this article at the following link:

http://e360.yale.edu/feature/why_wave_power_has_lagged_far_behind_as_energy_source/2760/

You’ll find a June 2014 presentation entitled, “Wave Energy Technology Brief,” by the International Renewable Energy Agency (IRENA) at the following link:

http://www.irena.org/documentdownloads/publications/wave-energy_v4_web.pdf

The general consensus seems to be that the wave energy industry is at about the same level of maturity as the wind and solar energy industries were about 30 years ago, in the 1980s.

Several U.S. firms offer autonomous floating devices that are capable of extracting energy from the motion of ocean waves and generating usable, persistent, renewable electric power. Two of the leaders in this field are Ocean Power Technologies, Inc. (OPT) in Pennington, NJ (with subsidiaries in the UK and Australia) and Northwest Energy Innovations, LLC (NWEI) in Portland, OR. Let’s take a look at their products

Ocean Power Technologies, Inc. (OPT)

OPT (http://www.oceanpowertechnologies.com) is the developer of the PowerBuoy®, which is a moored ocean buoy that extracts energy from the heave (vertical motion) of ocean waves and converts this into electrical energy for marine applications (i.e., offshore oil, gas, scientific and military applications) or for distribution to onshore facilities and/or connection to an onshore electric power grid. OPT currently offers PowerBuoy® in two power output ranges: up to 350 watts and up to 15 kW.

PowerBuoy   Source: OPT

The modest output from individual PowerBuoys® can be combined via an Undersea Substation Pod into a scalable wave farm to deliver significant power output to the intended user.

PowerBuoy wave farm
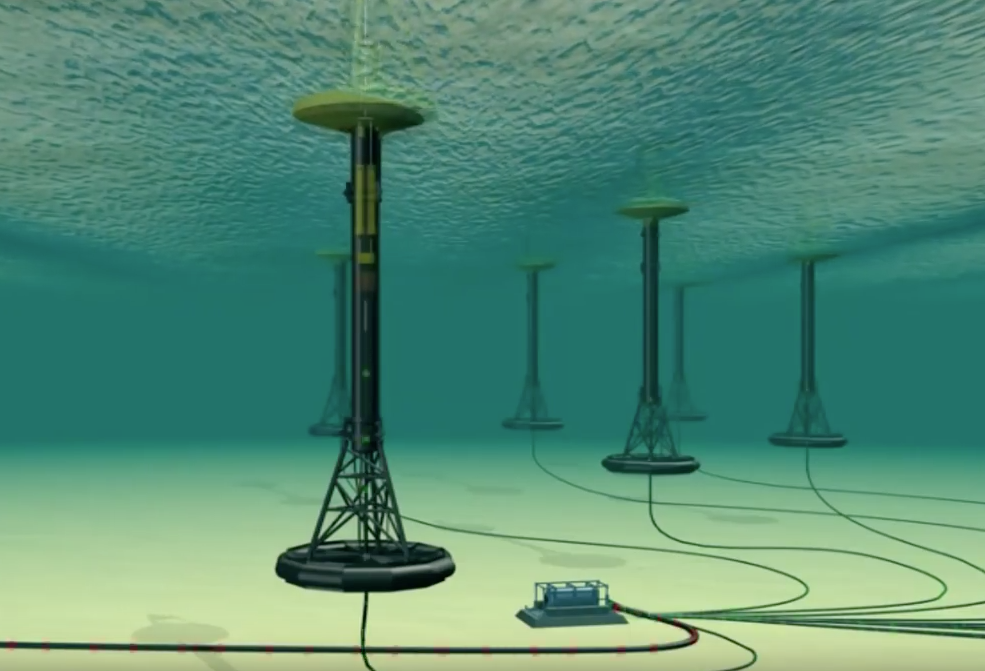
OPT wave farm concept. Source: OPT

You’ll find a description of PowerBuoy® design and operation on the OPT website at the following link:

http://www.oceanpowertechnologies.com/powerbuoy/

OPT describes their PowerBuoy® as follows:

“The PowerBuoy consists of a float, spar, and heave plate as shown in the (following) schematic…… The float moves up and down the spar in response to the motion of the waves. The heave plate maintains the spar in a relatively stationary position. The relative motion of the float with respect to the spar drives a mechanical system contained in the spar that converts the linear motion of the float into a rotary one. The rotary motion drives electrical generators that produce electricity for the payload or for export to nearby marine applications using a submarine electrical cable. This high performance wave energy conversion system generates power even in moderate wave environments.

The PowerBuoy’s power conversion and control systems provide continuous power for these applications under the most challenging marine conditions. The spar contains space for additional battery capacity if required to ensure power is provided to a given application even under extended no wave conditions.”

PowerBuoy diagram    Source: OPT

On the OPT website, you’ll find several technical presentations on the PowerBuoy® at the following link:

http://www.oceanpowertechnologies.com/technology/

Northwest Energy Innovations, LLC (NWEI)

NWEI (http://azurawave.com) is the developer of the Azura™ wave energy device, which is a moored ocean buoy that extracts power from both the heave (vertical motion) and surge (horizontal motion) of waves to maximize energy extraction. Electric power is generated by the relative motion of a rotating / oscillating float and the hull of the Azura™ wave energy device.
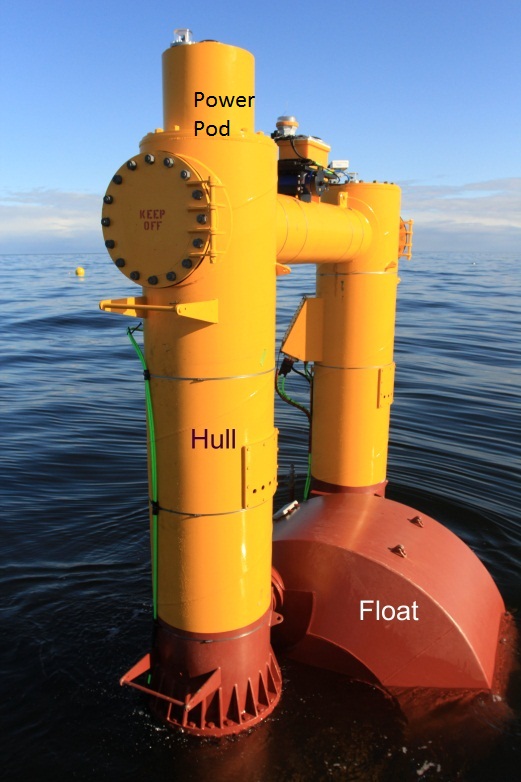
Hull-Float-Pod   Source: NWEI

You can see a short video on the operating principle of the Azura™ wave energy device at the following link:

http://azurawave.com/technology/

In 2012, the Azura prototype was fabricated and deployed at the Northwest National Marine Renewable Energy Center (NNMREC) ocean test site offshore from Newport, OR.

NNMREC site map
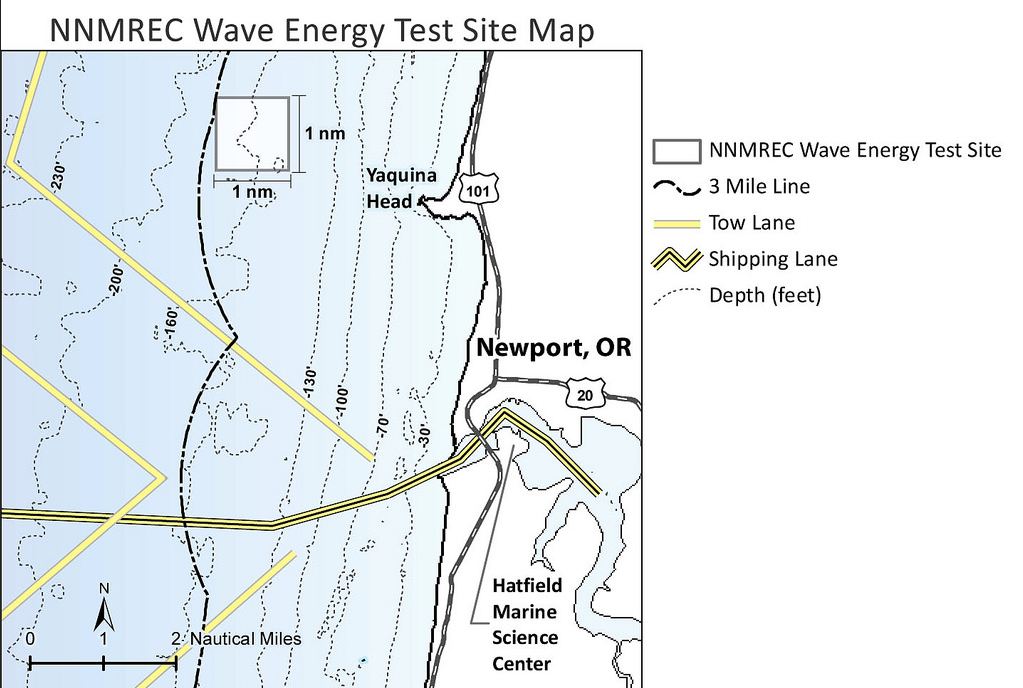
Source: flickr / Oregon State University

On May 30, 2015, under a Department of Energy (DOE) and U.S. Navy sponsored program, NWEI deployed the improved Azura™ prototype at the Navy’s Wave Energy Test Site at the Marine Corps Base, Kaneohe Bay, Oahu, Hawaii. The Azura prototype extends 12 feet above the surface and 50 feet below the surface. It generates up to 18 kW of electricity.
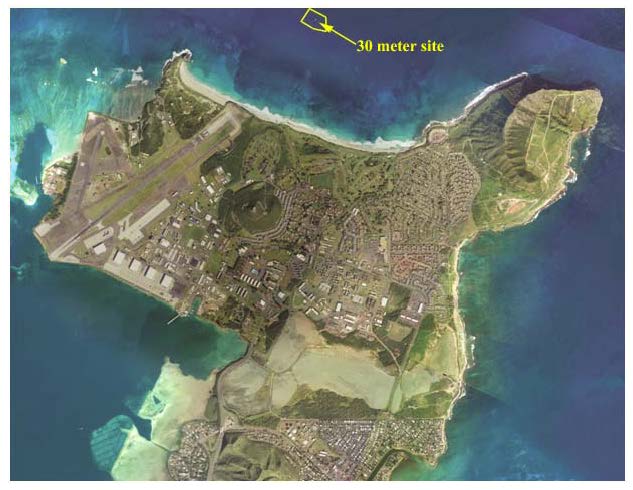
NWETS site photo Source: NWEI

You can view a short video on the Azura being installed at the offshore site in Kaneohe Bay at the following link:

https://www.youtube.com/watch?v=LAqNOTSoNHs

In September 2016, the Azura™ prototype reached a notable milestone when it became the first wave-powered generator connected to a U.S. commercial power grid.

Conclusions

I think we all can all agree that the technology for wave-generated power still is pretty immature. The cost of wave-generated power currently is very high in comparison to most alternatives, including wind and solar power. Nonetheless, there is a lot of energy in ocean waves and the energy density can be higher than wind or solar. As the technology matures, this is an industry worth watching, but you’ll have to be patient.

Bio-fuel at Less Than Half the Price

Peter Lobner

1.  New process for manufacturing bio-fuel

The Joint BioEnergy Institute (JBEI) is a Department of Energy (DOE) bioenergy research center dedicated to developing advanced bio-fuels, which are liquid fuels derived from the solar energy stored in plant biomass. Such fuels currently are replacing gasoline, diesel and jet fuels in selected applications.

On 1 July 2016, a team of Lawrence Berkeley National Laboratory (LBNL) and Sandia National Laboratories (SNL) scientists working at JBEI published a paper entitled, “CO2 enabled process integration for the production of cellulosic ethanol using bionic liquids.” The new process reported in this paper greatly simplifies the industrial manufacturing of bio-fuel and significantly reduces waste stream volume and toxicity as well as manufacturing cost.

The abstract provides further information:

“There is a clear and unmet need for a robust and affordable biomass conversion technology that can process a wide range of biomass feedstocks and produce high yields of fermentable sugars and bio-fuels with minimal intervention between unit operations. The lower microbial toxicity of recently developed renewable ionic liquids (ILs), or bionic liquids (BILs), helps overcome the challenges associated with the integration of pretreatment with enzymatic saccharification and microbial fermentation. However, the most effective BILs known to date for biomass pretreatment form extremely basic pH solutions in the presence of water, and therefore require neutralization before the pH range is acceptable for the enzymes and microbes used to complete the biomass conversion process. Neutralization using acids creates unwanted secondary effects that are problematic for efficient and cost-effective biorefinery operations using either continuous or batch modes.

We demonstrate a novel approach that addresses these challenges through the use of gaseous carbon dioxide to reversibly control the pH mismatch. This approach enables the realization of an integrated biomass conversion process (i.e., “single pot”) that eliminates the need for intermediate washing and/or separation steps. A preliminary technoeconomic analysis indicates that this integrated approach could reduce production costs by 50–65% compared to previous IL biomass conversion methods studied.”

 Regarding the above abstract, here are a couple of useful definitions:

  • Ionic liquids: powerful solvents composed entirely of paired ions that can be used to dissolve cellulosic biomass into sugars for fermentation.
  • Enzymatic saccharification: breaking complex carbohydrates such as starch or cellulose into their monosaccharide (carbohydrate) components, which are the simplest carbohydrates, also known as single sugars.

The paper was published on-line in the journal, Energy and Environmental Sciences, which you can access via the following link:

http://pubs.rsc.org/en/content/articlelanding/2016/ee/c6ee00913a#!divAbstract

Let’s hope they’re right about the significant cost reduction for bio-fuel production.

2.  Operational use of bio-fuel

One factor limiting the wide-scale use of bio-fuel is its higher price relative to the conventional fossil fuels it is intended to replace. The prospect for significantly lower bio-fuel prices comes at a time when operational use of bio-fuel is expanding, particularly in commercial airlines and in the U.S. Department of Defense (DoD). These bio-fuel users want advanced bio-fuels that are “drop-in” replacements to traditional gasoline, diesel, or jet fuel. This means that the advanced bio-fuels need to be compatible with the existing fuel distribution and storage infrastructure and run satisfactorily in the intended facilities and vehicles without introducing significant operational or maintenance / repair / overhaul (MRO) constraints.

You will find a fact sheet on the DoD bio-fuel program at the following link:

http://www.americansecurityproject.org/dods-biofuels-program/

The “drop in” concept can be difficult to achieve because a bio-fuel may have different energy content and properties than the petroleum fuel it is intended to replace. You can find a Department of Energy (DOE) fuel properties comparison chart at the following link:

http://www.afdc.energy.gov/fuels/fuel_comparison_chart.pdf

Another increasingly important factor affecting the deployment of bio-fuels is that the “water footprint” involved in growing the biomass needed for bio-fuel production and then producing the bio-fuel is considerably greater than the water footprint for conventional hydrocarbon fuel extraction and production.

 A.  Commercial airline use of bio-fuel:

Commercial airlines became increasingly interested in alternative fuels after worldwide oil prices peaked near $140 in 2008 and remained high until 2014.

A 2009 Rand Corporation technical report, “Near-term Feasibility of Alternative Jet Fuels,” provides a good overview of issues and timescales associated with employment of bio-fuels in the commercial aviation industry. Important findings included:

  • Drop-in” fuels have considerable advantages over other alternatives as practical replacements for petroleum-based aviation fuel.
  • Alcohols do not offer direct benefits to aviation, primarily because high vapor pressure poses problems for high-altitude flight and safe fuel handling. In addition, the reduced energy density of alcohols relative to petroleum-based aviation fuel would substantially reduced aircraft operating capabilities and would be less energy efficient.
  • Biodiesel and biokerosene, collectively known as FAMEs, are not appropriate for use in aviation, primarily because they leave deposits at the high temperatures found in aircraft engines, freeze at higher temperatures than petroleum-based fuel, and break down during storage

You can download this Rand report at the following link

http://www.rand.org/content/dam/rand/pubs/technical_reports/2009/RAND_TR554.pdf

After almost two years of collaboration with member airlines and strategic partners, the International Air Transport Association (IATA) published the report, “IATA Guidance Material for Biojet Fuel Management,” in November 2012. A key finding in this document is the following:

“To be acceptable to Civil Aviation Authorities, aviation turbine fuel must meet strict chemical and physical criteria. There exist several specifications that authorities refer to when describing acceptable conventional jet fuel such as ASTM D1655 and Def Stan 91-91. At the time of issue, blends of up to 50% biojet fuel produced through either the Fischer-Tropsch (FT) process or the hydroprocessing of oils and fats (HEFA – hydroprocessed esters and fatty acids) are acceptable for use under these specifications, but must first be certified under ASTM D7566. Once the blend has demonstrated compliance with the relevant product specifications, it may be regarded as equivalent to conventional jet fuel in most applications.“

You can download this IATA document at the following link:

https://www.iata.org/publications/Documents/guidance-biojet-management.pdf

In 2011, KLM flew the world’s first commercial bio-fuel flight, carrying passengers from Amsterdam to Paris. Also in 2011, Aeromexico flew the world’s first bio-fuel trans-Atlantic revenue passenger flight, from Mexico City to Madrid.

In March 2015, United Airlines (UA) inaugurated use of bio-fuel on flights between Los Angeles (LAX) and San Francisco (SFO). Eventually, UA plans to expand the use of bio-fuel to all flights operating from LAX. UA is the first U.S. airline to use renewable fuel for regular commercial operation.

Many other airlines worldwide are in various stages of bio-fuel testing and operational use.

B.  U.S. Navy use of bio-fuel:

The Navy is deploying bio-fuel in shore facilities, aircraft, and surface ships. Navy Secretary Ray Mabus has established a goal to replace half of the Navy’s conventional fuel supply with renewables by 2020.

In 2012, the Navy experimented with a 50:50 blend of traditional petroleum-based fuel and biofuel made from waste cooking oil and algae oil.   This blend was used successfully on about 40 U.S. surface ships that participated in the Rim of the Pacific (RIMPAC) exercise with ships of other nations. The cost of pure bio-fuel fuel for this demonstration was about $26.00 per gallon, compared to about $3.50 per gallon for conventional fuel at that time.

In 2016, the Navy established the “Great Green Fleet” (GGF) as a year-long initiative to demonstrate the Navy’s ability to transform its energy use.

Great Green Fleet logo          Source: U.S. Navy

The Navy described this initiative as follows:

“The centerpiece of the Great Green Fleet is a Carrier Strike Group (CSG) that deploys on alternative fuels, including nuclear power for the carrier and a blend of advanced bio-fuel made from beef fat and traditional petroleum for its escort ships. These bio-fuels have been procured by DON (Department of Navy) at prices that are on par with conventional fuels, as required by law, and are certified as “drop-in” replacements that require no engine modifications or changes to operational procedures.”

Deployment of the Great Green Fleet started in January 2016 with the deployment of Strike Group 3 and its flagship, the nuclear-powered aircraft carrier USS John C. Stennis. The conventionally-powered ships in the Strike Group are using a blend of 10% bio-fuel and 90% petroleum. The Navy originally aimed for a 50:50 ratio, but the cost was too high. The Navy purchased about 78 million gallons of blended bio-fuel for the Great Green Fleet at a price of $2.05 per gallon.

C.  U.S. Air Force use of bio-fuel:

The USAF has a goal of meeting half its domestic fuel needs with alternative sources by 2016, including aviation fuel.

The Air Force has been testing different blends of jet fuel and biofuels known generically as Hydrotreated Renewable Jet (HRJ). This class of fuel uses triglycerides and free fatty acids from plant oils and animal fats as the feedstock that is processed to create a hydrocarbon aviation fuel.

To meet its energy plan, the USAF plans to use a blend that combines military-grade fuel known as JP-8 with up to 50 percent HRJ. The Air Force also has certified a 50:50 blend of Fisher-Tropsch synthetic kerosene and conventional JP-8 jet fuel across its fleet.

The Air Force Civil Engineer Support Agency (AFCESA), headquartered at Tyndall Air Force Base, Florida is responsible for certifying the USAF aviation fuel infrastructure to ensure its readiness to deploy blended JP-8/bio-fuel.

U.S. Energy Information Administration’s (EIA) Early Release of a Summary of its Annual Energy Outlook (AEO) Provides a Disturbing View of Our Nation’s Energy Future

Peter Lobner

Each year, the EIA issues an Annual Energy Outlook that provides energy industry recent year data and projections for future years. The 2016 AEO includes actual data of 2014 and 2015, and projections to 2040. These data include:

  • Total energy supply and disposition demand
  • Energy consumption by sector and source
  • Energy prices by sector and source
  • Key indicators and consumption by sector (Residential, Commercial, Industrial, Transportation)
  • Electricity supply, disposition, prices and emissions
  • Electricity generating capacity
  • Electricity trade

On 17 May, EIA released a PowerPoint summary of AEO2016 along with the data tables used in this Outlook.   The full version of AEO2016 is scheduled for release on 7 July 2016.

You can download EIA’s Early Release PowerPoint summary and any of the data tables at the following link:

http://www.eia.gov/forecasts/aeo/er/index.cfm

EIA explains that this Summary features two cases: the Reference case and a case excluding implementation of the Clean Power Plan (CPP).

  • Reference case: A business-as-usual trend estimate, given known technology and technological and demographic trends. The Reference case assumes Clean Power Plan (CPP) compliance through mass-based standards (emissions reduction in metric tones of carbon dioxide) modeled using allowances with cooperation across states at the regional level, with all allowance revenues rebated to ratepayers.
  • No CPP case: A business-as-usual trend estimate, but assumes that CPP is not implemented.

You can find a good industry assessment of the AEO2016 Summary on the Global Energy World website at the following link:

http://www.globalenergyworld.com/news/24141/Obama_Administration_s_Electricity_Policies_Follow_the_Failed_European_Model.htm

A related EIA document that is worth reviewing is, Assumptions to the Annual Energy Outlook 2015, which you will find at the following link:

http://www.eia.gov/forecasts/aeo/assumptions/

This report presents the major assumptions of the National Energy Modeling System (NEMS) used to generate the projections in AE02015. A 2016 edition of Assumptions is not yet available. The functional organization of NEMS is shown below.

EIA NEMS

The renewable fuels module in NEMS addresses solar (thermal and photovoltaic), wind (on-shore and off-shore), geothermal, biomass, landfill gas, and conventional hydroelectric.

The predominant renewable sources are solar and wind, both of which are intermittent sources of electric power generation. Except for the following statements, the EIA assumptions are silent on the matter of energy storage systems that will be needed to manage electric power quality and grid stability as the projected use of intermittent renewable generators grows.

  • All technologies except for storage, intermittents and distributed generation can be used to meet spinning reserves
  • The representative solar thermal technology assumed for cost estimation is a 100-megawatt central-receiver tower without integrated energy storage
  • Pumped storage hydroelectric, considered a nonrenewable storage medium for fossil and nuclear power, is not included in the supply

In my 4 March 2016 post, “Dispatchable Power from Energy Storage Systems Help Maintain Grid Stability,” I addressed the growing importance of such storage systems as intermittent power generators are added to the grid. In the context of the AEO, the EIA fails to address the need for these costly energy storage systems and they fail to allocate the cost of energy storage systems to the intermittent generators that are the source of the growing demand for the energy storage systems. As a result, the projected price of energy from intermittent renewable generators is unrealistically low in the AEO.

Oddly, NEMS does not include a “Nuclear Fuel Module.” Nuclear power is represented in the Electric Market Module, but receives no credit as a non-carbon producing source of electric power. As I reported in my posts on the Clean Power Plan, the CPP gives utilities no incentives to continue operating nuclear power plants or to build new nuclear power plants (see my 27 November 2015 post, “Is EPA Fudging the Numbers for its Carbon Regulation,” and my 2 July 2015 post, “EPA Clean Power Plan Proposed Rule Does Not Adequately Recognize the Role of Nuclear Power in Greenhouse Gas Reduction.”). With the current and expected future low price of natural gas, nuclear power operators are at a financial disadvantage relative to operators of large central station fossil power plants. This is the driving factor in the industry trend of early retirement of existing nuclear power plants.

The following 6 May 2016 announcement by Exelon highlights the current predicament of a high-performing nuclear power operator:

“Exelon deferred decisions on the future of its Clinton and Quad Cities plants last fall to give policymakers more time to consider energy market and legislative reforms. Since then, energy prices have continued to decline. Despite being two of Exelon’s highest-performing plants, Clinton and Quad Cities have been experiencing significant losses. In the past six years, Clinton and Quad Cities have lost more than $800 million, combined.“

“Exelon announced today that it will need to move forward with the early retirements of its Clinton and Quad Cities nuclear facilities if adequate legislation is not passed during the spring Illinois legislative session, scheduled to end on May 31 and if, for Quad Cities, adequate legislation is not passed and the plant does not clear the upcoming PJM capacity auction later this month.”

“Without these results, Exelon would plan to retire Clinton Power Station in Clinton, Ill., on June 1, 2017, and Quad Cities Generating Station in Cordova, Ill., on June 1, 2018.”

You can read Exelon’s entire announcement at the following link:

http://www.exeloncorp.com/newsroom/exelon-statement-on-early-retirement-of-clinton-and-quad-cities-nuclear-facilities

Together the Clinton and Quad Cities nuclear power plants have a combined Design Electrical Rating of 2,983 MWe from a non-carbon producing source. For the period 2013 – 2015, the U.S. nuclear power industry as a whole had a net capacity factor of 90.41. That means that the nuclear power industry delivered 90.41% of the DER of the aggregate of all U.S. nuclear power plants. The three Exelon plants being considered for early retirement exceeded this industry average performance with the following net capacity factors: Quad Cities 1 @ 101.27; Quad Cities 2 @ 92.68, and Clinton @ 91.26.

For the same 2013 – 2015 period, EIA reported the following net capacity factors for wind (32.96), solar photovoltaic (27.25), and solar thermal (21.25).  Using the EIA capacity factor for wind generators, the largest Siemens D7 wind turbine, which is rated at 7.0 MWe, delivers an average output of about 2.3 MWe. We would need more than 1,200 of these large wind turbines just to make up for the electric power delivered by the Clinton and Quad Cities nuclear power plants. Imagine the stability of that regional grid.

CPP continues subsidies to renewable power generators. In time, the intermittent generators will reduce power quality and destabilize the electric power grid unless industrial-scale energy storage systems are deployed to enable the grid operators to match electricity supply and demand with reliable, dispatchable power.

As a nation, I believe we’re trending toward more costly electricity with lower power quality and reliability.

I hope you share my concerns about this trend.

Dispatchable Power from Energy Storage Systems Help Maintain Grid Stability

Peter Lobner

On 3 March 2015, Mitsubishi Electric Corporation announced the delivery of the world’s largest energy storage system, which has a rated output of 50 MW and a storage capacity of 300 MWh. The battery-based system is installed in Japan at Kyushu Electric Power Company’s Buzen Power Plant as part of a pilot project to demonstrate the use of high-capacity energy storage systems to balance supply and demand on a grid that has significant, weather-dependent (intermittent), renewable power sources (i.e., solar and/or wind turbine generators). This system offers energy-storage and dispatch capabilities similar to those of a pumped hydro facility. You can read the Mitsubishi press release at the following link:

http://www.mitsubishielectric.com/news/2016/pdf/0303-b.pdf

The energy storage system and associated electrical substation installation at Buzen Power Plant are shown below. The energy storage system is comprised of 63 4-module units, where each module contains sodium-sulfur (NaS) batteries with a rated output of 200 kW. The modules are double stacked to reduce the facility’s footprint and cost.

Buzen Power Plant - JapanSource: Mitsubishi

The following simplified diagram shows how the Mitsubishi grid supervisory control and data acquisition (SCADA) system matches supply with variable demand on a grid with three dispatchable energy sources (thermal, pumped hydro and battery storage) and one non-dispatchable (intermittent) energy source (solar photovoltaic, PV). As demand varies through the day, thermal power plants can maneuver (within limits) to meet increasing load demand, supplemented by pumped hydro and battery storage to meet peak demands and to respond to the short-term variability of power from PV generators. A short-term power excess is used to recharge the batteries. Pumped hydro typically is recharged over night, when the system load demand is lower.

Mitsubishi SCADA

Above diagram: Mitsubishi BLEnDer® RE Battery SCADA System (Source: Mitsubishi)

Battery storage is only one of several technologies available for grid-connected energy storage systems. You can read about the many other alternatives in the December 2013 Department of Energy (DOE) report, “Grid Energy Storage”, which you can download at the following link:

http://www.sandia.gov/ess/docs/other/Grid_Energy_Storage_Dec_2013.pdf

This 2013 report includes the following figure, which shows the rated power of U.S. grid storage projects, including announced projects.

US 2013 grid  storage projectsSource: DOE

As you can see, battery storage systems, such as the Mitsubishi system at Buzen Power Plant, comprise only a small fraction of grid-connected energy storage systems, which currently are dominated in the U.S. by pumped hydro systems. DOE reported that, as of August 2013, there were 202 energy storage systems deployed in the U.S. with a total installed power rating of 24.6 GW. Energy storage capacity (i.e., GWh) was not stated. In contrast, total U.S. installed generating capacity in 2013 was over 1,000 GW, so fully-charged storage systems can support about 2.4% of the nation’s load demand for a short period of time.

Among DOE’s 2013 strategic goals for grid energy storage systems are the following cost goals:

  • Near-term energy storage systems:
    • System capital cost: < $1,750/kW; < $250/kWh
    • Levelized cost: < 20¢ / kWh / cycle
    • System efficiency: > 75%
    • Cycle life: > 4,000 cycles
  • Long-term energy storage systems:
    • System capital cost: < $1,250/kW; < $150/kWh
    • Levelized cost: < 10¢ / kWh / cycle
    • System efficiency: > 80%
    • Cycle life: > 5,000 cycles

Using the DOE near-term cost goals, we can estimate the cost of the energy storage system at the Buzen Power Plant to be in the range from $75 – 87.5 million. DOE estimated that the storage devices contributed 30 – 40% of the cost of an energy storage system.  That becomes a recurring operating cost when the storage devices reach their cycle life limit and need to be replaced.

The Energy Information Agency (EIA) defines capacity factor as the ratio of a generator’s actual generation over a specified period of time to its maximum possible generation over that same period of time. EIA reported the following installed generating capacities and capacity factors for U.S. wind and solar generators in 2015:

US renewable power 2015

Currently there are 86 GW of intermittent power sources connected to the U.S. grid and that total is growing year-on-year. As shown below, EIA expects 28% growth in solar generation and 16% growth in wind generation in the U.S. in 2016.

Screen Shot 2016-03-03 at 1.22.06 PMSource: EIA

The reason we need dispatchable grid storage systems is because of the proliferation of grid-connected intermittent generators and the need for grid operators to manage grid stability regionally and across the nation.

California’s Renewables Portfolio Standard (RPS) Program has required that utilities procure 33% of their electricity from “eligible renewable energy resources” by 2020. On 7 October 2015, Governor Jerry Brown signed into law a bill (SB 350) that increased this goal to 50% by 2030. There is no concise definition of “eligible renewable energy resources,” but you can get a good understanding of this term in the 2011 California Energy Commission guidebook, “Renewables Portfolio Standard Eligibility – 4th Edition,” which you can download at the following link:

http://www.energy.ca.gov/2010publications/CEC-300-2010-007/CEC-300-2010-007-CMF.PDF

The “eligible renewable energy resources” include solar, wind, and other resources, several of which would not be intermittent generators.

In 2014, the installed capacity of California’s 1,051 in-state power plants (greater than 0.1 megawatts – MW) was 86.9 GW. These plants produced 198,908 GWh of electricity in 2014. An additional 97,735 GWh (about 33%) was imported from out-of-state generators, yielding a 2014 statewide total electricity consumption of almost 300,000 GWh of electricity. By 2030, 50% of total generation is mandated to be from “eligible renewable energy resources,” and a good fraction of those resources will be operating intermittently at average capacity factors in the range from 22 – 33%.

The rates we pay as electric power customers in California already are among the highest in the nation, largely because of the Renewables Portfolio Standard (RPS) Program. With the higher targets for 2030, we soon will be paying even more for the deployment, operation and maintenance of massive new grid-connected storage infrastructure that will be needed to keep the state and regional grids stable.

Solar Impulse 2 Preparing for the Next Leg of its Around-the-World Journey

Peter Lobner

In my 10 March 2015 post, I provided basic information of the remarkable Solar Impulse 2 aircraft and its mission to be the first aircraft to fly around the world on solar power. On 10 July 2015, I posted a summary of the first eight legs of the around the world flight, which started in Abu Dhabi on 9 March 2015 and ended on 3 July at Kalaeloa, a small airport outside Honolulu, Hawaii.

After arriving in Hawaii, the Solar Impulse team determined that the batteries had been damaged due to overheating on the first day of the Leg 8 flight and would have to be replaced. Solar Impulse reported the following root cause for the overheating:

“Since the plane had been exposed to harsh weather conditions from Nanjing to Nagoya, we decided to do a test flight before leaving for Hawaii. Having to perform a test flight followed by a mission flight had not been taken into account in the design process of the battery system, which did not allow the batteries to cool down in between the two” (flights).

By November 2015, the Solar Impulse engineers had upgraded the design of the whole battery system and integrated a battery cooling system. You can read the details on the Solar Impulse website at the following link:

http://blog.solarimpulse.com/post/133346944960/cool-batteries-solarimpulse

A further delay in starting Leg 9 was caused by the seasonal shortening of daylight hours in the Northern hemisphere. The late autumn and winter daylight hours weren’t long enough to allow the batteries to be fully recharged during the day along the planned route to the U.S. mainland and back to Abu Dhabi.

Solar Impulse 2 routeSource: Solar Impulse

On 26 February 2016, the upgraded Solar Impulse II made a successful “maintenance” flight in Hawaii. The flight lasted 93 minutes, reached an altitude of 8,000 feet (2,400 meters), and included tests of the stabilization and battery cooling systems.

Solar Impulse is planning to restart its around-the-world journey on 20 April 2016.

Solar Impulse composite photo over HawaiiSource: Solar Impulse

You can subscribe to news releases from the Solar Impulse team at the following link:

http://www.solarimpulse.com/subscribe

Is EPA Fudging the Numbers for its Carbon Regulation?

Peter Lobner

In my 2 July 2015 post, I commented on significant deficiencies in the U.S. Environmental Protection Agency (EPA) Clean Power Plan proposed rule. On 3 August 2015, the EPA announced the final rule. You can read the final rule for existing power plants, the EPA’s regulatory impact analysis, and associated fact sheets at the following link:

http://www2.epa.gov/cleanpowerplan/clean-power-plan-existing-power-plants

The Institute for Energy Research (IER) is a not-for-profit organization that conducts research and analysis on the functions, operations, and government regulation of global energy markets. The IER home page is at the following link:

http://instituteforenergyresearch.org

On 24 November 2015, the IER published an insightful article entitled, Is EPA Fudging the Numbers for its Carbon Regulation?, which I believe is worth your attention. The IER’s main points are:

  1. U.S. Energy Information Agency’s (EIA) Annual Energy Outlook (AEO) is the data source usually used by federal government agencies in their analysis of energy issues.
  2. EPA stands out as an exception. It frequently chooses not to use EIA data, and instead develops it’s own duplicative, different data.
  3. In the case of the Clean Power Plan, the EPA’s own data significantly underestimates the number of coal plants that need to be retired to comply with the Plan. The result is a much lower estimate of the economic impact of the Plan than if EIA data had been used.

It appears to me that the EPA created and used data skewed to produce a more favorable, but likely unrealistic, estimate of the economic impact that will borne by the U.S. power industry and power customers as the Clean Power Plan is implemented. Form your own opinion after reading the full IER article at the following link:

http://instituteforenergyresearch.org/analysis/is-epa-fudging-the-numbers-for-its-carbon-regulation/

Update 19 Feb 2016

On 8 February 2016, the American Nuclear Society (ANS) released their, “Nuclear in the States Toolkit Version 1.0 – Policy Options for States Considering the Role of Nuclear Power in Their Energy Mix.” The toolkit catalogs policies related to new and existing nuclear reactors for state policymakers to consider as they draft their Clean Power Plan compliance strategies.   The Toolkit identifies a range of policy options that individually or in aggregate can make nuclear generation a more attractive generation alternative for states and utilities.

You can download this document at the following link:

http://nuclearconnect.org/wp-content/uploads/2016/02/ANS-NIS-Toolkit-download.pdf

On 9 February 2016, the U.S. Supreme Court issues a stay on implementation of the EPA’s Clean Power Plan (CPP) pending the resolution of legal challenges to the program in court.

The ANS noted that, “….the stay provides them (the states) an opportunity to take a new look at the carbon offsets that existing nuclear plants provide, which they weren’t encouraged to do under the CPP rules.”

What are the Sources of Electric Power in the USA?

Peter Lobner

The sources of electric power used in California have changed significantly between 2004 and 2014. The distribution of California’s energy sources, among natural gas, renewables (wind & solar), hydroelectric, and nuclear is shown in the following chart. California does not use coal or petroleum to generate electric power.

CA energy use 2004 - 2014  USA energy use 2004 - 2014

Nationally, on a percentage basis, coal use is on the decline and use of natural gas and renewables is on the increase in most states.

Check out the following NPR website, which is the source of the above charts, to see similar charts for all 50 states.

http://www.npr.org/2015/09/10/319535020/coal-gas-nuclear-hydro-how-your-state-generates-power?utm_source=howtogeek&utm_medium=email&utm_campaign=newsletter

Building a Modern Wind Turbine Generator

Peter Lobner

MidAmerican Energy Company, Iowa’s largest energy company, began installing wind turbines in 2004. In May 2013, MidAmerican Energy announced their latest plan to invest up to $1.9 billion to expand its wind generation fleet and add up to 1,050 MWe of wind generation in Iowa by year-end 2015. Once this expansion is complete, approximately 3,335 MWe, or approximately 39%, of MidAmerican Energy’s total owned generation capacity will come from wind-powered generation from 1,715 wind turbines.

MidAmerica Energy wind turbines Source: MidAmerica Energy

You can visit the wind energy page on the MidAmerica Energy website at the following link:

http://www.midamericanenergy.com/wind_overview.aspx

Fact sheets on this site provide details on the two types of wind turbines currently being installed:

  • 1.5 MWe General Electric wind turbine (most common in the MidAmerica fleet)
  • 2.3 MWe Siemens wind turbine (largest in the MidAmerica fleet)

The impressive dimensions of the larger Siemens machine are shown in the following diagram:

MidAmerica Energy 2.3 MWe wind turbine Source: MidAmerica Energy

MidAmerican Energy Company has posted a 5+ minute time-lapse video on YouTube showing their three-week construction process for the Siemens wind turbine. This is worth watching to get a better understanding of the modest site preparation work required, the very large scale of the pedestal and rotor components, and the short time frame required to complete a wind turbine generator and have it ready to be put into revenue-generating service.  You can view the video at the following link:

https://www.youtube.com/embed/84BeVq2Jm88?feature=player_detailpage

Now complete this process several hundred times and you have a respectable sized wind farm.

The U.S. Energy Information Administration (EIA) defines “capacity factor” as follows:

“Capacity factors describe how intensively a fleet of generators is run. A capacity factor near 100% means a fleet is operating nearly all of the time. It is the ratio of a fleet’s actual generation to its maximum potential generation”.

EIA reports average monthly and annual capacity factors for utility generators. For utility generators not primarily using fossil fuels, the results are at the following link:

http://www.eia.gov/electricity/monthly/epm_table_grapher.cfm?t=epmt_6_07_b

Here are average capacity factors reported by EIA:

EIA capacity factors 1

As a renewable power source, wind has a significantly higher capacity factor than solar. However, over the long term, a wind farm delivers only about one-third of it’s “nameplate rating.” This statistic, of course, does not capture the real-time variability in electrical output as wind conditions constantly change.

As a point of comparison, you can find the EIA capacity factor results for utility generators primarily using fossil fuels at the following link:

http://www.eia.gov/electricity/monthly/epm_table_grapher.cfm?t=epmt_6_07_a

Here are average capacity factors reported by EIA for selected fossil generators (I only included those that are likely to be base loaded):

EIA capacity factors 2

EPA Clean Power Plan Proposed Rule Does Not Adequately Recognize the Role of Nuclear Power in Greenhouse Gas Reduction

Peter Lobner

On June 2, 2014, the U.S. Environmental Protection Agency (EPA) proposed what they called, “a common sense plan to cut carbon pollution from power plants.”  You can access the Clean Power Plan Proposed Rule and many related documents at the following EPA link:

http://www2.epa.gov/carbon-pollution-standards/clean-power-plan-proposed-rule

This Plan proposes to limit carbon emissions from existing fossil fuel fired electric generating units, including steam generating, integrated gasification combined cycle, or stationary combustion turbines (in either simple-cycle or combined-cycle configuration) operating or under construction by January 8, 2014. Main points of the Clean Power Plan include:

  • Wind and solar power are the preferred EPA options.
  • Natural gas is an interim solution.
  • New nuclear capacity is not a compliance option.
  • The EPA allows compliance credit for:
    • New nuclear plants currently under construction, and
    • Preservation of existing nuclear plants that might otherwise be retired

I’ve already formed my opinion on the Clean Power Plan. To help you form your opinion, I recommend that you refer to the following recent analyses by four respected government and industry organizations that have reviewed the Clean Power Plan.

Institute for Energy Research (IER)

On 15 June 2015, the IER issued the results of their analysis entitled, EPA’s Clean Power Plan Ignores New Nuclear as a Compliance Option. IER concluded that the compliance formulae in the Clean Power Plan are biased toward new wind and solar power development. Deployment of these technologies, which currently are not capable of delivering reliable capacity, will decrease the reliability of the electric grid. IER also concluded that the Clean Power Plan will result in much higher electricity prices for all American consumers, while having only a marginal impact on global temperature based on EPA’s computer models.

You can read the IER analysis at the following link:

http://instituteforenergyresearch.org/analysis/epas-clean-power-plan-ignores-new-nuclear-as-a-compliance-option/

National Association of Clean Air Agencies (NACAA)

On 21 May 2015, the NACAA issued a report entitled, Implementing EPA’s Clean Power Plan: A Menu of Options, containing 25 chapters, each of which explores a particular approach to greenhouse gas (GHG) reduction in the electric power sector.  NACAA is a nonpartisan, nonprofit association of air pollution control agencies in 41 states, the District of Columbia, four territories and 116 metropolitan areas.  Each chapter of their Menu of Options includes a brief descriptions of: (1) the option and it’s pros and cons; (2) the regulatory backdrop, policy underpinnings, implementation experience, and GHG reduction potential associated with the option; and (3) benefits of the option to society and the utility system, including costs and cost-effectiveness. In the last chapter, a variety of emerging technologies and other policy options for reducing GHG emissions are addressed.

An interesting table and two figures included in Chapter 6 of the Menu of Options are reproduced below.

NACAA Table 6-1 Source: NACAA

In 2012, electric power generation technologies with zero or low GHG emissions accounted for 31.4% of the USA’s total generating capacity. The data in Table 6-1 shows that 82.2% of the zero or low GHG emission generating capacity came from nuclear and hydroelectric power plants. The remaining low-emission generation capacity came from biomass, wind, geothermal, and solar power plants.

NACAA Figure 6-3Source: NACAA

In Figure 6-3, “life cycle GHG emissions” include those associated with operation as well as construction, fabrication, and fuel processing.  While nuclear power is not included among the “technologies powered by renewable resources”, it’s clear in Figure 6-3 that nuclear power meets the GHG reduction performance of the other technologies using renewable resources.

NACAA Figure 6-7  Source: NACAA

In Figure 6-7, note the relative cost-of-energy differential between nuclear power and fossil power. This difference makes it difficult for nuclear power plants to compete head-to-head with coal and natural gas merchant power plants and encourages the early retirement of some nuclear power plants on economic grounds.  While most renewable power sources have even higher costs-of-energy, various financial schemes subsidize their power generation.

You can download individual chapters or the entire NACAA Menu of Options at the following link:

http://www.4cleanair.org/NACAA_Menu_of_Options

U.S. Energy Information Administration (EIA)

On 22 May 2015, the EIA released their analysis of the Clean Power Plan. The EIA analysis supports the IER finding that the Clean Power Plan will result in much higher electricity prices for all American consumers, even in a scenario that allows GHG reduction credit for new nuclear generation.

You can read the EIA press release at the following link:

http://www.eia.gov/analysis/requests/powerplants/cleanplan/

You also can download a PDFs copy of the May 2015 EIA report, Analysis of the Impacts of the Clean Power Plan, at the following link:

http://www.eia.gov/analysis/requests/powerplants/cleanplan/pdf/powerplant.pdf

Nuclear Energy Institute’s (NEI)

To address the “clean power” attributes of nuclear power, I refer you to an NEI Knowledge Center webpage: Environment: Emissions Prevented, which you will find at the following link:

http://www.nei.org/Knowledge-Center/Nuclear-Statistics/Environment-Emissions-Prevented

Here you’ll find a link to data on the amount of sulfur dioxide, nitrogen oxides, and carbon dioxide emissions avoided in the U.S. during the years 1995 to 2014 by virtue of having about 20% of U.S. electric power generated by nuclear power plants instead of fossil power plants. NEI reports the total avoided emissions for this period as follows:

  • Sulfur dioxide: 57.75 million short tons (52.4 million metric tons)
  • Nitrogen oxides: 22.92 million short tons (20.8 million metric tons)
  • Carbon dioxide: 13,063.6 million short tons (11,851 million metric tons)

On this website, NEI states:

“Nuclear energy facilities avoided 595 million metric tons of carbon dioxide in 2014 across the U.S. This is nearly as much carbon dioxide as is released from nearly 135 million cars, which is more than all U.S. passenger cars. The U.S. produces more than five billion metric tons of carbon dioxide each year.

Without the emission avoidances from nuclear generation, required reductions in the U.S. would increase by more than 50 percent to achieve targets under the Kyoto Protocol.”

2013 paper, “Prevented Mortality and Greenhouse Gas Emissions from Historical and Projected Nuclear Power”.

Supporting the above NEI position on the GHG reduction merits of nuclear power, there is a related 2013 article by NASA scientists from Goddard Institute for Space Studies and Columbia University entitled, “Prevented Mortality and Greenhouse Gas Emissions from Historical and Projected Nuclear Power”.  You can read a short article on this paper on the Scientific American website at the following link:

http://blogs.scientificamerican.com/the-curious-wavefunction/nuclear-power-may-have-saved-1-8-million-lives-otherwise-lost-to-fossil-fuels-may-save-up-to-7-million-more/

You also can read the complete paper at the following link:

http://pubs.acs.org/doi/pdf/10.1021/es3051197

In their study, authors Pushker A. Kharecha and James E. Hansen used historical production data from 1971 to 2009 and calculated that global nuclear power has prevented an average of 1.84 million air pollution-related deaths and 64 gigatonnes of CO2-equivalent (GtCO2-eq) greenhouse gas (GHG) emissions that would have resulted from fossil fuel burning. From their analysis, the authors drew the following conclusion:

“In conclusion, it is clear that nuclear power has provided a large contribution to the reduction of global mortality and GHG emissions due to fossil fuel use. If the role of nuclear power significantly declines in the next few decades, the International Energy Agency asserts that achieving a target atmospheric GHG level of 450 ppm CO2-eq would require “heroic achievements in the deployment of emerging low- carbon technologies, which have yet to be proven. Countries that rely heavily on nuclear power would find it particularly challenging and significantly more costly to meet their targeted levels of emissions.”

So, what do you think about the EPA’s proposed Clean Power Plan? Is this the “common sense plan to cut carbon pollution from power plants” promised by EPA; a politically motivated piece of crap designed to kill the nuclear and coal power industries; or something in between?

Efficiency in Electricity Generation

Peter Lobner

On 9 March 2015, Siemens announced that it had achieved a generation efficiency record at the Cengiz Enerji Samsun combined-cycle gas turbine power plant in Turkey. With an installed capacity of 600 MWe, this plant achieves a net efficiency of almost 61%. This makes Cengiz Enerji Samsun the most efficient fossil-fired 50 Hz power plant in 2015, not only in Turkey, but in the world.

You can read more at the following link:

http://www.globalenergyworld.com/news/15838/Siemens_Achieves_Record_Efficiency_With_The_Samsun_H-class_Power_Plant.htm

If you wonder how this level of generation efficiency compares to other types of electric power generators, then I recommend that you read the July 2003 report, “Efficiency in Electric Power Generation,” drafted by Union of the Electricity Industry – EURELECTRIC (Brussels, Belgium) and VGB PowerTech (Essen, Germany).

Report cover page

While this report is 12 years old, I think it remains one of the best single sources of comparative efficiency information on a very wide range of generator types. You can download a pdf version of this report by doing an Internet search for:

Efficiency in electricity generation – Eurelectric

The link you need should be at or near the top of your search results.

Eurelectric pdf document search result

One of the key results presented in this report is a chart showing comparative efficiencies. The new Cengiz Enerji Samsun power plant raises the bar a few percentage points for “Large gas fired CCGT power plant”.

5 July 2016 update:  New record for fossil plant efficiency

On 17 June 2016, General Electric (GE) and Électricité de France (EDF) began operating the first ever combined-cycle power plant equipped with GE’s 9HA large gas turbine.  GE advertises the 9HA as the “world’s largest and most efficient heavy duty gas turbine”.  There are two models, 9HA.01 and 9HA.02 that have claimed simple cycle outputs and net efficiencies of 397 MWe @ 41.5% net efficiency, and 510 MWe @ 41.8% net efficiency, respectively.  In a combined cycle application, the power outputs and efficiencies increase substantially.  GE claims the 9HA.01 delivers 592 MWe @ 61.6% net efficiency, while the 9HA.02 delivers 755 MWe @ 61.8% net efficiency.  You can download a GE specification sheet on the 9HA at the following link:

https://powergen.gepower.com/content/dam/gepower-pgdp/global/en_US/documents/product/gas%20turbines/Fact%20Sheet/9ha-fact-sheet-oct15.pdf

With regard to the new 605 MWe combined cycle 9HA.01 power plant at Bouchain, France, GE announced that this plant has been recognized by Guinness World Records as the world’s most efficient combined-cycle power plant, with a demonstrated net efficiency of 62.22% (better than advertised by GE).  You can read the GE announcement at the following link:

https://powergen.gepower.com/about/insights/bouchain-grand-opening.html