Category Archives: STEM Education

Sputnik 1 Boosted Support for Science, Engineering and Mathematics Education, but it Didn’t Last

Peter Lobner

Sputnik 1 was launched on 4 October 1957 by the Soviet Union and became the first man-made object to be placed into Earth orbit.  See my 4 October 2017 post discussing the 60th anniversary of this event.

The launch of Sputnik 1, and the subsequent launches of Sputnik 2 on 4 October 1957 and Sputnik 3 on 15 May 1958, prompted calls for more technical education in the U.S. One reaction was the National Defense Education Act (NDEA) passed by Congress and signed by President Dwight Eisenhower on 2 September 1958.  A primary goal of NDEA was to help align the nation’s educational systems to better meet the nation’s security needs, particularly in the areas of science, engineering and mathematics, where the U.S. was being challenged by the Soviet Union.

You can read more on the NDEA here:

https://www.britannica.com/topic/National-Defense-Education-Act

It’s ironic that today, more than 60 years after Sputnik 1 was launched, our nation’s educational system is still trying to figure out how to deliver science, technology, engineering and mathematics education, now under the popular banner “STEM”  (or “STEAM”, so the Arts don’t feel left out).

As I discussed in my 13 December 2016 post, “The PISA 2015 Report Provides an Insightful International Comparison of U.S. High School Student Performance,”the U.S. was ranked 40thin math, 25thin science, and 24thin reading among 73 international educational systems.  PISA 2015 provided strong evidence that students in many other nations are better prepared in science and math than their peers in the U.S.  You can read that post here:

https://lynceans.org/all-posts/the-pisa-2015-report-provides-an-insightful-international-comparison-of-u-s-high-school-student-performance/

The National Academies Press (NAP) recently (2018) published two reports of consensus studies concerning the delivery of STEM education and a framework for assessing the status and quality of that education.  The first is entitled, “Indicators for Monitoring Undergraduate STEM Education.”
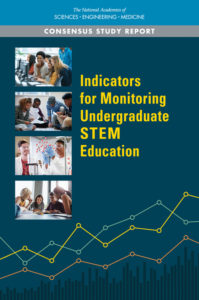
    Source:  NAP

NAP describes this report as follows:

“Science, technology, engineering and mathematics (STEM) professionals generate a stream of scientific discoveries and technological innovations that fuel job creation and national economic growth. Ensuring a robust supply of these professionals is critical for sustaining growth and creating jobs growth at a time of intense global competition. Undergraduate STEM education prepares the STEM professionals of today and those of tomorrow, while also helping all students develop knowledge and skills they can draw on in a variety of occupations and as individual citizens. However, many capable students intending to major in STEM later switch to another field or drop out of higher education altogether, partly because of documented weaknesses in STEM teaching, learning and student supports. Improving undergraduate STEM education to address these weaknesses is a national imperative.

Many initiatives are now underway to improve the quality of undergraduate STEM teaching and learning. Some focus on the national level, others involve multi-institution collaborations, and others take place on individual campuses. At present, however, policymakers and the public do not know whether these various initiatives are accomplishing their goals and leading to nationwide improvement in undergraduate STEM education.

Indicators for Monitoring Undergraduate STEM Education outlines a framework and a set of indicators that document the status and quality of undergraduate STEM education at the national level over multiple years. It also indicates areas where additional research is needed in order to develop appropriate measures. This publication will be valuable to government agencies that make investments in higher education, institutions of higher education, private funders of higher education programs, and industry stakeholders. It will also be of interest to researchers who study higher education.”

You can download this report here:

https://www.nap.edu/catalog/24943/indicators-for-monitoring-undergraduate-stem-education

The second report is entitled, “Graduate STEM Education for the 21stCentury.”
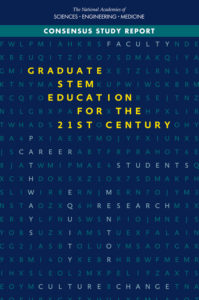
    Source:  NAP

NAP describes this report as follows:

“The U.S. system of graduate education in science, technology, engineering, and mathematics (STEM) has served the nation and its science and engineering enterprise extremely well. Over the course of their education, graduate students become involved in advancing the frontiers of discovery, as well as in making significant contributions to the growth of the U.S. economy, its national security, and the health and well being of its people. However, continuous, dramatic innovations in research methods and technologies, changes in the nature and availability of work, shifts in demographics, and expansions in the scope of occupations needing STEM expertise raise questions about how well the current STEM graduate education system is meeting the full array of 21st century needs. Indeed, recent surveys of employers and graduates and studies of graduate education suggest that many graduate programs do not adequately prepare students to translate their knowledge into impact in multiple careers.

Graduate STEM Education for the 21st Century examines the current state of U.S. graduate STEM education. This report explores how the system might best respond to ongoing developments in the conduct of research on evidence-based teaching practices and in the needs and interests of its students and the broader society it seeks to serve. This will be an essential resource for the primary stakeholders in the U.S. STEM enterprise, including federal and state policymakers, public and private funders, institutions of higher education, their administrators and faculty, leaders in business and industry, and the students the system is intended to educate.”

You can download this report here:

https://www.nap.edu/catalog/25038/graduate-stem-education-for-the-21st-century

Hopefully, today’s investments in STEM education will yield tangible results that will help strengthen the position of the U.S. among the very broad field of international competitors vying for a piece of, or dominance in, various segments of the modern technology market.

Energy Literacy

Peter Lobner

I was impressed in 2007 by the following chart in Scientific American, which shows where our energy in the U.S. comes from and how the energy is used in electricity generation and in four consumer sectors. One conclusion is that more than half of our energy is wasted, which is clearly shown in the bottom right corner of the chart. However, this result shouldn’t be surprising.

2007 USA energy utilizationSource: Scientific American / Jen Christiansen, using LLNL & DOE 2007 data

The waste energy primarily arises from the efficiencies of the various energy conversion cycles being used. For example, the following 2003 chart shows the relative generating efficiencies of a wide range of electric power sources. You can see in the chart that there is a big plateau at 40% efficiency for many types of thermal cycle power plants. That means that 60% of the energy they used is lost as waste heat. The latest combined cycle plants have demonstrated net efficiencies as high as 62.22% (Bouchain, France, 2016, see details in my updated 17 March 2015 post, “Efficiency in Electricity Generation”).

Comparative generation  efficiencies-Eurelectric 2003Source: Eurelectric and VGB PowerTech, July 2003

Another source of waste is line loss in electricity transmission and distribution from generators to the end-users. The U.S. Energy Information Administration (EIA) estimates that electricity transmission and distribution losses average about 6% of the electricity that is transmitted and distributed.

There is an expanded, interactive, zoomable map of U.S. energy data that goes far beyond the 2007 Scientific American chart shown above. You can access this interactive map at the following link:

http://energyliteracy.com

The interactivity in the map is impressive, and the way it’s implemented encourages exploration of the data in the map. You can drill down on individual features and you can explore particular paths in much greater detail than you could in a physical chart containing the same information. Below are two example screenshots. The first screenshot is a top-level view. As in the Scientific American chart, energy sources are on the left and final disposition as energy services or waste energy is on the right. Note that waste energy is on the top right of the interactive map.

Energy literacy map 1

The second screenshot is a more detailed view of natural gas production and utilization.

Energy literacy map 2

As reported by Lulu Chang on the digitaltrends.com website, this interactive map was created by Saul Griffith at the firm Otherlab (https://otherlab.com). You can read her post at the following link:

http://www.digitaltrends.com/home/otherlab-energy-chart/

I hope you enjoy exploring the interactive energy literacy map.

BLOODHOUND SSC Making Progress Toward a World Land Speed Record Attempt

Peter Lobner

The BLOODHOUND Project bills itself as an international education initiative focused around a 1,000 mph World Land Speed Record attempt.

“The primary objective of the Project is to inspire the next generation to pursue careers in science, engineering, technology and math – by demonstrating how they can be harnessed to achieve the impossible, such as a jet and rocket powered car capable of setting a new World Land Speed Record.”

Since my first post in the BLOODHOUND Project on 2 March 2015, the project team has made great progress in designing, developing, constructing and testing the BLOODHOUND SSC (supersonic car) and its many components and systems.  This will be a very interesting year as the BLOODHOUND Project works up to a world land speed record attempt currently planned for November 2017 on Hakskeen Pan in South Africa.

You’ll find the BLOODHOUND website, with its many resources, at the following link:

http://www.bloodhoundssc.com

You can subscribe to the BLOODHOUND newsletter here:

http://www.bloodhoundssc.com/newsletter-signup

The project team has established an extensive video record of their work on YouTube. Starting at their YouTube home page at the following link, you can navigate through a very interesting video library.

https://www.youtube.com/channel/UCsBrBl7xmnNBkosxCeHGqPA

On 9 January 2017, the BLOODHOUND Project announced that they had launched a new series of short video programs that will take viewers through the inner workings of the land speed record car. The first video in the Anatomy of the Car series is at the following link:

https://www.youtube.com/watch?v=0bfL2XC0Fa0

BLOODHOUND SSCBLOODHOUND SSC X-raySource, both images: The BLOODHOUND Project

You can subscribe to the BLOODHOUND videos directly on their YouTube home page.

I hope you will share my enthusiasm for this inspirational international project and take time to understand the remarkable systems integration work being done by the BLOODHOUND Project.

The PISA 2015 Report Provides an Insightful International Comparison of U.S. High School Student Performance

Peter Lobner

In early December 2016, the U.S. Department of Education and the Institute for Educational Sciences’ (IES) National Center for Educational Statistics (NCES) issued a report entitled, “Performance of U.S. 15-Year-Old Students in Science, Reading, and Mathematics Literacy in an International Context: First Look at PISA 2015.”

PISA 2015 First Look cover

The NCES describes PISA as follows:

“The Program for International Student Assessment (PISA) is a system of international assessments that allows countries to compare outcomes of learning as students near the end of compulsory schooling. PISA core assessments measure the performance of 15-year old students in science, reading and mathematics literacy every 3 years. Coordinated by the Organization for Economic Cooperation and Development (OECD), PISA was first implemented in 2000 in 32 countries. It has since grown to 73 educational systems in 2015. The United States has participated in every cycle of PISA since its inception in 2000. In 2015, Massachusetts, North Carolina and Puerto Rico also participated separately from the nation. Of these three, Massachusetts previously participated in PISA 2012.”

In each country, the schools participating in PISA are randomly selected, with a goal that the sample of student selected for the examination are representative of a broad range of backgrounds and abilities. About 540,000 students participated in PISA 2015, including about 5,700 students from U.S. public and private schools. All participants were rated on a 1,000 point scale.

The authors describe the contents of the PISA 2015 report as follows:

“ The report includes average scores in the three subject areas; score gaps across the three subject areas between the top (90th percentile) and low performing (10th percentile) students; the percentages of students reaching selected PISA proficiency levels; and trends in U.S. performance in the three subjects over time.”

You can download the report from the NCES website at the following link:

https://nces.ed.gov/pubsearch/pubsinfo.asp?pubid=2017048

In the three subject areas assessed by PISA 2015, key U.S. results include the following:

  • Math:
    • U.S. students ranked 40th (out of 73) in math
    • U.S. average score was 470, which is below the international average of 490
    • 29% of U.S. students did not meet the baseline proficiency for math
    • 6% of U.S. students scored in the highest proficiency range for math
    • U.S. average math scores have been declining over the last two PISA cycles since 2009
  • Science:
    • U.S. ranked 25th in science
    • U.S. average was 496, which is very close to the international average of 493
    • 20% of U.S. students did not meet the baseline proficiency for science
    • 9% of U.S. students scored in the highest proficiency range for science
    • U.S. average science scores have been flat over the last two PISA cycles since 2009
  • Reading:
    • U.S. ranked 24th in reading
    • U.S. average was 497, which is very close to the international average of 493
    • 19% of U.S. students did not meet the baseline proficiency for reading
    • 10% of U.S. students scored in the highest proficiency range for reading
    • U.S. average reading scores have been flat over the last two PISA cycles since 2009

In comparison, students in the small nation of Singapore were the top performers in all three subject areas, recording the following results in PISA 2015:

  • Math: 564
  • Science: 556
  • Reading: 535

Japan, South Korea, Canada, Germany, New Zealand, Australia, Hong Kong (China), Estonia, and Netherlands were among the countries that consistently beat the U.S. in all three subject areas.

China significantly beat the U.S. in math and science and was about the same in reading. Russia significantly beat the U.S. in math, but was a bit behind in science and reading.

Numerous articles have been written on the declining math performance and only average science and reading performance of the U.S. students that participated in PISA 2015. Representative articles include:

US News: 6 December 2016 article, “Internationally, U.S. Students are Failing”

http://www.usnews.com/news/politics/articles/2016-12-06/math-a-concern-for-us-teens-science-reading-flat-on-test

Washington Post: 6 December 2016, “On the World Stage, U.S. Students Fall Behind”

https://www.washingtonpost.com/local/education/on-the-world-stage-us-students-fall-behind/2016/12/05/610e1e10-b740-11e6-a677-b608fbb3aaf6_story.html?utm_term=.c33931c67010

I think the authors of these articles are correct and the U.S. educational system is failing to develop students in high school that, on average, will be able to compete effectively in a knowledge-based world economy with many of their international peers.

Click the link to the PISA 2015 report (above) and read about the international test results for yourself.

ANOMALY– a Truly Impressive Augmented Reality (AR) Graphic Novel – Demonstrates how AR is Revolutionizing Printed Documents With Digital, Virtual Pop-ups

Peter Lobner

Pop-up books and cards have existed for a very long time, becoming popular in Europe in the late 1800s and in the U.S. in the early 1900s.

Old pop-up book         Source: The Harold M. Goralnick Pop-up Book Collection

You can get a good overview on the history and applications of physical pop-ups at the following Bowdoin College link:

http://www.bowdoin.edu/news/archives/1bowdoincampus/008200.shtml

At the above website, you’ll find a link to a short Vimeo video on the 2011 Bowdoin College exhibition: Pop-ups! They’re not JUST for Kids, which you also can access directly at the following link:

https://vimeo.com/19580829

At Comic-Con 2016 in San Diego, I was introduced to a remarkable digital, virtual pop-up technology in the form of the large-scale, hard cover graphic novel ANOMALY.

Anomaly-graphic-novel  Source: Anomaly Productions Inc.

The creators of ANOMALY explain:

“ANOMALY is the longest full-color original graphic novel ever created, but that’s not all. It’s also enhanced with state-of-the-art AUGMENTED REALITY technology. Simply point your smartphone or tablet at pages in the book and watch characters come to life with 3D ANIMATION and interactivity!”

A stand-alone free app is needed on your mobile device to bring the selected pages of ANOMALY to life. Hidden AR cues on the printed pages are used to activate the corresponding AR feature in the app. When first published in 2012, there were 50 AR pages in the 370 pages of ANOMALY; now there are 60 AR pages. The capability exists to add AR features via software updates after the physical book has been published.

You can get a sense for what AR brings to a printed document in the following short ANOMALY commercial trailer:

https://www.youtube.com/watch?v=jU0TzccuAGE

Below are three screenshots from that video to illustrate basic capabilities:

The virtual pop-up feature enables the reader to visualize a 3D interactive model that is animated and can include audio.

Anomaly trailer screenshot 1

Touch features on the virtual page can be used to bring up more detailed written information and animations related to the selected object. This is a drill-down capability that links to information not included on the printed page.

Anomaly trailer screenshot 2

Anomaly trailer screenshot 3

I think you’ll also enjoy the following video demonstration by the co-founder of ANOMALY, Brian Haberlin:

https://www.youtube.com/watch?v=jU0TzccuAGE

In the above video, you’ll see that this AR technology also can be implemented on small printed items like a postcard.

Below are a few screenshots I took using my copy of the book and the book app. With an iPhone, it was easy to view the complete 3-D model of the spaceship shown below, which was flying through an animated star field. The 3D model has a relatively high level of detail, so you can move in with your mobile device to see small features on the spaceship. Mirror your mobile device to a large screen TV for a really impressive view of the virtual pop-ups.

Anomaly spaceship1Anomaly spaceship2Some objects shown in less detail in the book can be viewed as much more detailed, animated 3-D virtual objects, as shown below:Anomaly example 3-D objectPeople and creatures come to life as animated 3-D models standing on the page. The creature below growled and reacted when touched, but it didn’t bite.Anomaly example 3-D animal

ANOMALY, which was published in 2012, isn’t the first application of VR technology to a printed document. However, it is the first to demonstrate this technology on such a grand scale. James Hoare, writing for the SciFiNow website, noted:

“Marvel Comics have been similarly using (AR) to great effect across their Marvel Wow! titles – a whole world of 3D animation and 2D pop-ups, background details and more open up to you – ranging from the gimmicky, to the genuinely enriching, as critters scuttle across the page, and dossiers on planets and people make themselves available.”

Now imagine the potential applications of this AR technology in science, technology, engineering and math (STEM) courses. Given the challenge of attracting young people to these disciplines, modern AR interactive texts and postcard-size flash cards should be able to deliver an engaging environment for both the teacher and the student. Mirroring the teacher’s mobile device to a large flat panel display is a simple means to engage even a large classroom full of students.

If you were teaching a STEM class, what do you think would be a good application of this AR technology for that class (Hint: The answer does not involve sitting in the back of the classroom reading ANOMALY with your own mobile device).

A Framework for K-12 Science Education

Peter Lobner

NAP K-12 science education Source: NAP

The National Academies Press (NAP) describes this new book as follows:

“Science, engineering, and technology permeate nearly every facet of modern life and hold the key to solving many of humanity’s most pressing current and future challenges. The United States’ position in the global economy is declining, in part because U.S. workers lack fundamental knowledge in these fields. To address the critical issues of U.S. competitiveness and to better prepare the workforce, A Framework for K-12 Science Education proposes a new approach to K-12 science education that will capture students’ interest and provide them with the necessary foundational knowledge in the field.

A Framework for K-12 Science Education outlines a broad set of expectations for students in science and engineering in grades K-12. These expectations will inform the development of new standards for K-12 science education and, subsequently, revisions to curriculum, instruction, assessment, and professional development for educators. This book identifies three dimensions that convey the core ideas and practices around which science and engineering education in these grades should be built. These three dimensions are: crosscutting concepts that unify the study of science through their common application across science and engineering; scientific and engineering practices; and disciplinary core ideas in the physical sciences, life sciences, and earth and space sciences and for engineering, technology, and the applications of science. The overarching goal is for all high school graduates to have sufficient knowledge of science and engineering to engage in public discussions on science-related issues, be careful consumers of scientific and technical information, and enter the careers of their choice.

A Framework for K-12 Science Education is the first step in a process that can inform state-level decisions and achieve a research-grounded basis for improving science instruction and learning across the country. The book will guide standards developers, teachers, curriculum designers, assessment developers, state and district science administrators, and educators who teach science in informal environments.”

You can download a free pdf copy of this book for free at the following link:

http://www.nap.edu/catalog/13165/a-framework-for-k-12-science-education-practices-crosscutting-concepts

While you are on the NAP website, browse their other available publications and you will find two NAP publications addressing Next Generation Science Standards (NGSS).  These NGSS documents build on the K-12 science education framework described above.  See my 31 March 2015 post for more details on NGSS.

Next Generation Science Standards (NGSS) for K – 12 students

Peter Lobner

Based on the National Research Council’s, “A Framework for K-12 Science Education,” the new NAP publication, “Next Generation Science Standards,” identifies “the science” all K-12 students should know. It is claimed that the NGSS present a vision of science and engineering learning designed to bring these subjects alive for all students, emphasizing the satisfaction of pursuing compelling questions and the joy of discovery and invention. You might find it interesting to review the topic-specific “Performance Expectations” at the various grade levels.

NGSS coverSource:  NAP

A separate document, “Guide to Implementing the NGSS,” is intended to provide guidance to district and school leaders and teachers charged with developing a plan and implementing the NGSS.

If you have set up a MyNAP account as described in my 14 March 2015 post, you can download pdf copies of these documents for free from NAP at the following link:

http://www.nap.edu/search/?term=next+generation+science+standards

7 January 2017 Update – Infographic – science and engineering practices

In January 2017, NAP published the following infographic poster (click the image to enlarge) and a corresponding interactive version that highlight science and engineering practices that should be mastered in STEM classroom.  You can download this poster at the following link:

https://www.nap.edu/visualizations/practices-for-k-12-classrooms/

NAP STEM chartSource:  NAP