Peter Lobner, updated 7 April 2020 & 19 January 2024
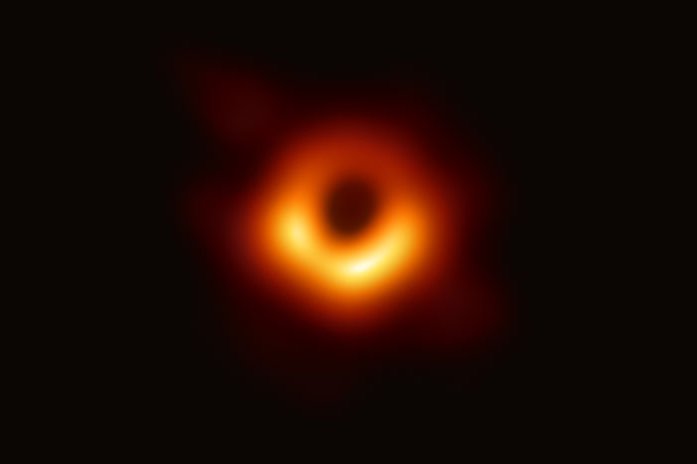
The first image of a black hole was released on 10 April 2019 at a press conference in Washington D.C. held by the Event Horizon Telescope (EHT) team and the National Science Foundation (NSF). The subject of the image is the supermassive black hole known as M87* located near the center of the Messier 87 (M87) galaxy. This black hole is about 55 million light years from Earth and is estimated to have a mass 6.5 billion times greater than our Sun. The image shows a glowing circular emission ring surrounding the dark region (shadow) containing the black hole. The brightest part of the image also may have captured a bright relativistic jet of plasma that appears to be streaming away from the black hole at nearly the speed of light, beaming generally in the direction of Earth.
The EHT is not one physical telescope. Rather, it an array of millimeter and sub-millimeter wavelength radio telescopes located around the world. The following map shows the eight telescopes that participated in the 2017 observations of M87. Three additional telescopes joined the EHT array in 2018 and later.
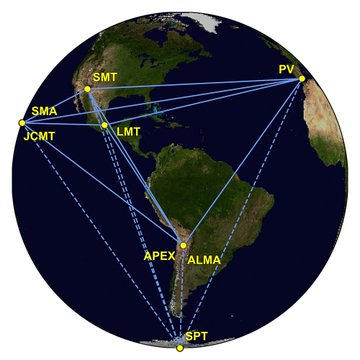
Source: The EHT Collaboration, et al.
All of the EHT telescopes are used on a non-dedicated basis by an EHT team of more than 200 researchers during a limited annual observing cycle. The image of the M87* black hole was created from observations made during a one week period in April 2017.
The long baselines between the individual radio telescopes give the “synthetic” EHT the resolving power of a physical radio telescope with a diameter that is approximately equal to the diameter of the Earth. A technique called very long-baseline interferometry (VLBI) is used to combine the data from the individual telescopes to synthesize the image of a black hole. EHT Director, Shep Doeleman, referred to VLBI as “the ultimate in delayed gratification among astronomers.” The magnifying power of the EHT becomes real only when the data from all of the telescopes are brought together and the data are properly combined and processed. This takes time.
At a nominal operating wavelength of about 1.3 mm (frequency of 230 GHz), EHT angular resolution is about 25 microarcseconds (μas), which is sufficient to resolve nearby supermassive black hole candidates on scales that correspond to their event horizons. The EHT team reports that the M87* bright emission disk subtends an angle of 42 ± 3 microarcseconds.
For comparison, the resolution of a human eye in visible light is about 60 arcseconds (1/60thof a degree; there are 3,600 arcseconds in one degree) and the 2.4-meter diameter Hubble Space Telescope has a resolution of about 0.05 arcseconds (50,000 microarcseconds).
You can read five open access papers on the first M87* Event Horizon Telescope results written by the EHT team and published on 10 April 2019 in the Astrophysical Journal Letters here:
- First M87 Event Horizon Telescope Results. I. The Shadow of the Supermassive Black Hole; https://iopscience.iop.org/article/10.3847/2041-8213/ab0ec7
- First M87 Event Horizon Telescope Results. II. Array and Instrumentation; https://iopscience.iop.org/article/10.3847/2041-8213/ab0c96
- First M87 Event Horizon Telescope Results. III. Data Processing and Calibration; https://iopscience.iop.org/article/10.3847/2041-8213/ab0c57
- First M87 Event Horizon Telescope Results. IV. Imaging the Central Supermassive Black Hole; https://iopscience.iop.org/article/10.3847/2041-8213/ab0e85
- First M87 Event Horizon Telescope Results. V. Physical Origin of the Asymmetric Ring; https://iopscience.iop.org/article/10.3847/2041-8213/ab0f43
Congratulations to the EHT Collaboration for their extraordinary success in creating the first-ever image of a black hole shadow.
7 April 2020 Update: EHT observations were complemented by multi-spectral (multi-messenger) observations by NASA spacecraft
On 10 April 2019, NASA reported on its use of several orbiting spacecraft to observe M87 in different wavelengths during the period of the EHT observation.
- “To complement the EHT findings, several NASA spacecraft were part of a large effort, coordinated by the EHT’s Multiwavelength Working Group, to observe the black hole using different wavelengths of light. As part of this effort, NASA’s Chandra X-ray Observatory, Nuclear Spectroscopic Telescope Array (NuSTAR) and Neil Gehrels Swift Observatory space telescope missions, all attuned to different varieties of X-ray light, turned their gaze to the M87* black hole around the same time as the EHT in April 2017. NASA’s Fermi Gamma-ray Space Telescope was also watching for changes in gamma-ray light from M87* during the EHT observations.”
- “NASA space telescopes have previously studied a jet extending more than 1,000 light-years away from the center of M87*. The jet is made of particles traveling near the speed of light, shooting out at high energies from close to the event horizon. The EHT was designed in part to study the origin of this jet and others like it.”
NASA’s Neutron star Interior Composition Explorer (NICER) experiment on the International Space Station also contributed to the multi-spectral observations of M87*, which were coordinated by EHT’s Multiwavelength Working Group.
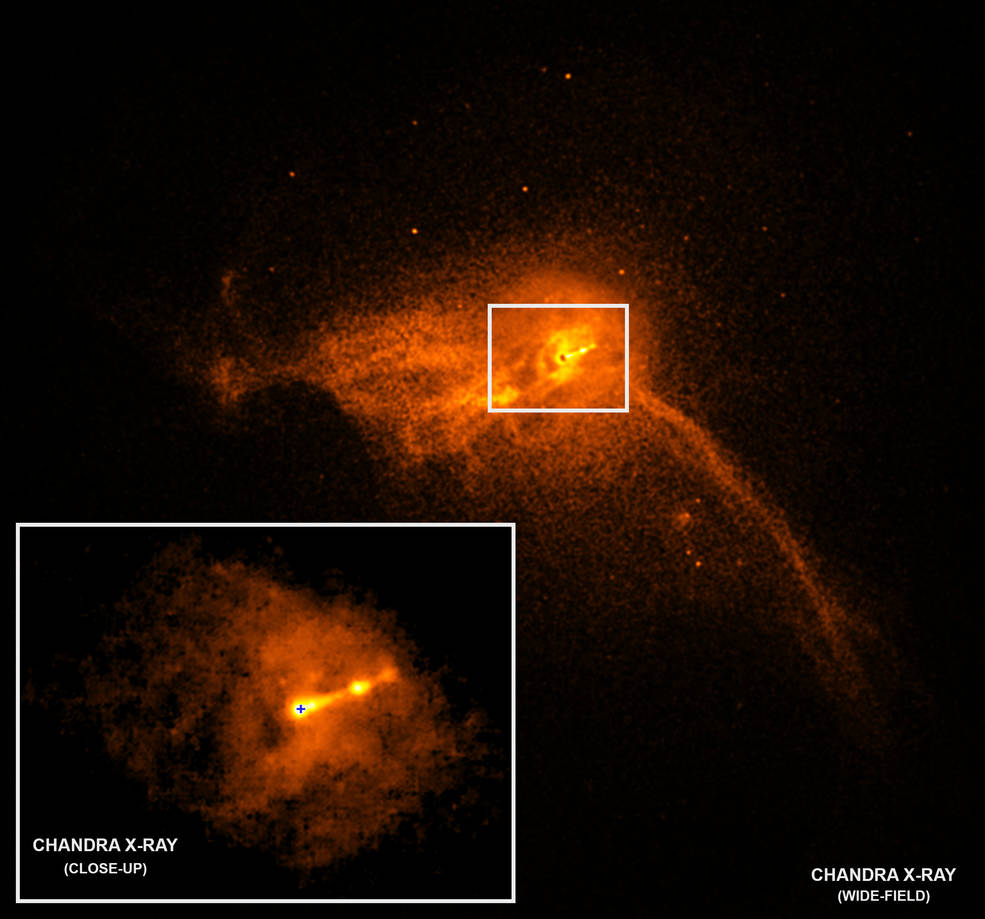
showing the location of the M87* black hole (+) and the relativistic jet.
Source: NASA/CXC/Villanova University/J. Neilsen
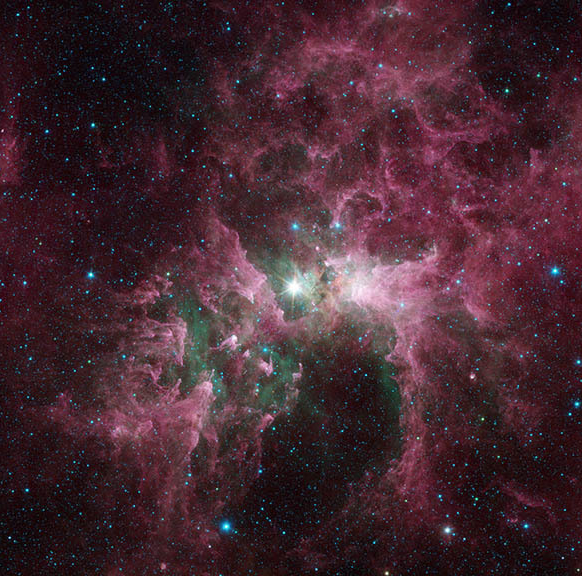
On April 25, 2019, NASA released the following composite image showing the M87 galaxy, the position of the M87* black hole and large relativistic jets of matter being ejected from the black hole. These infrared images were made by NASA’s orbiting Spitzer Space Telescope.
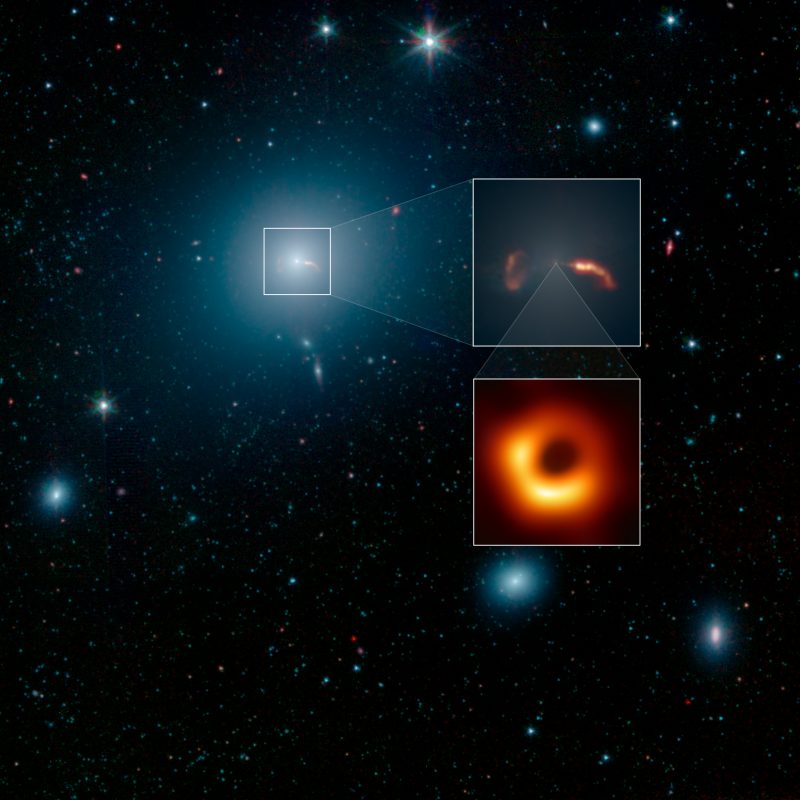
Source: NASA/JPL-Caltech/IPAC/Event Horizon Telescope
19 January 2024 Update: Results of the second M87* black hole EHT observation campaign
The original image of the M87* black hole released in April 2019 was derived from data collected during the April 2017 EHT observation campaign. In January 2024, the EHT Collaboration published the results of a second M87* black hole observation campaign, which took place in April 2018 with an improved global EHT array, wider frequency coverage, and increased bandwidth. This paper shows that the M87* black hole has maintained a similar size in the two images and that the brightest part of the ring surrounding the black hole has rotated about 30 degrees.
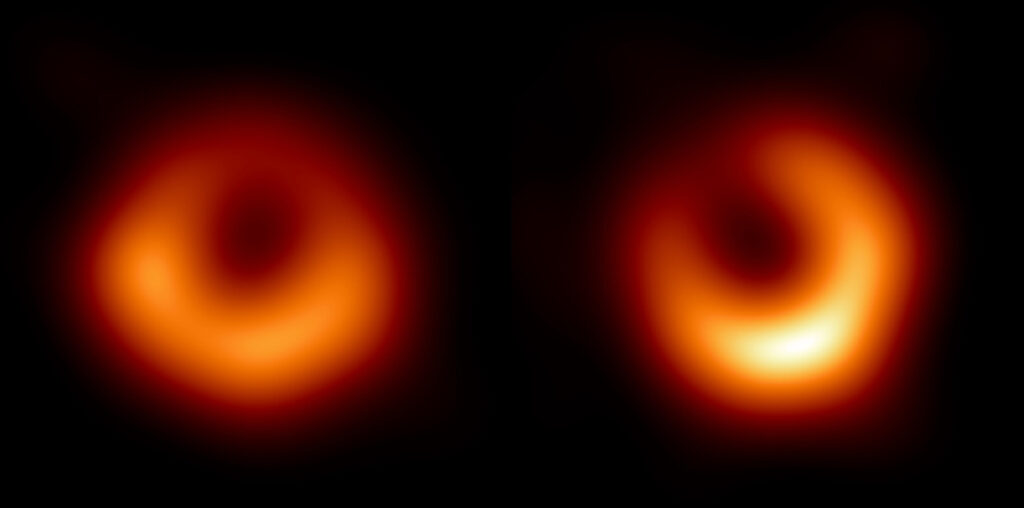
Original M87* black hole image (left) & an image from data collected one year later (right). Source: EHT Collaboration via Astronomy & Astrophysics (Jan 2024)
The EHT Collaboration concluded, “The perennial persistence of the ring and its diameter robustly support the interpretation that the ring is formed by lensed emission surrounding a Kerr black hole with a mass ∼6.5 × 10⁹ M⊙ (mass of the Sun). The significant change in the ring brightness asymmetry implies a spin axis that is more consistent with the position angle of the large-scale jet.”
For more information:
See the following sources for more information on the EHT and imaging the M87* black hole:
- Event Horizon Telescope website: https://eventhorizontelescope.org/about
- “The Event Horizon Telescope,” The Lyncean Group of San Diego, 3 March 2017: https://lynceans.org/all-posts/the-event-horizon-telescope/
- “Black Hole Image Makes History; NASA Telescopes Coordinated Observations,” NASA, 10 April 2019: https://www.nasa.gov/mission_pages/chandra/news/black-hole-image-makes-history
- Ota Lutz, “How Scientists Captured the First Image of a Black Hole,” NASA / Jet Propulsion Laboratory, 19 April 2019: https://www.jpl.nasa.gov/edu/news/2019/4/19/how-scientists-captured-the-first-image-of-a-black-hole/
- The Event Horizon Collaboration, et. al, “The persistent shadow of the supermassive black hole of M 87,” Astronomy & Astrophysics, Vol. 681, January 2024:https://www.aanda.org/articles/aa/abs/2024/01/aa47932-23/aa47932-23.html
- Daniel Clery, “Nearby galaxy’s giant black hole is real, ‘shadow’ image confirms,” Science, 18 January 2024: https://www.science.org/content/article/nearby-galaxy-s-giant-black-hole-real-shadow-image-confirms